Network Ping
Document Metadata
Category: Setup → Network → Network Ping
Audience: Administrators, Engineers, Support Team
Difficulty: Beginner to Intermediate
Time Required: 5–10 minutes
Prerequisites: ConnexCS account with access to the Setup section; access to the Network Ping tool dashboard.
Related Topics: Server Settings – Ping/MTR (for server-based latency tools), Security – ICMP Pings (network troubleshooting & reachability)
Next Steps: Use the Network Ping results to validate routing/latency and then proceed to: Server Settings or AnyEdge Configuration for performance optimisation.
The Network Ping tool is currently in Alpha mode. Functionality, data accuracy, and visual behavior may change as the feature is still under active development and testing.
Setup Network Ping
The Network Ping tool allows you to test how reachable an IP address is from different ConnexCS servers worldwide.
It provides a visual view of latency and packet response times, helping you understand how quickly ConnexCS servers can communicate with a given IP.
Purpose
The Network Ping feature allows users to:
- Check connectivity and response time between ConnexCS infrastructure and any target IP.
- Identify which ConnexCS AnyEdge zones can reach the destination and how they perform.
- Measure average latency to evaluate network health and routing quality.
Use Case
Network Ping helps administrators quickly:
- Troubleshoot latency problems between ConnexCS and external IPs.
- Verify network reachability for customer or carrier endpoints.
- Monitor performance of global ConnexCS zones.
How to Use
- Navigate to Setup Network Ping.
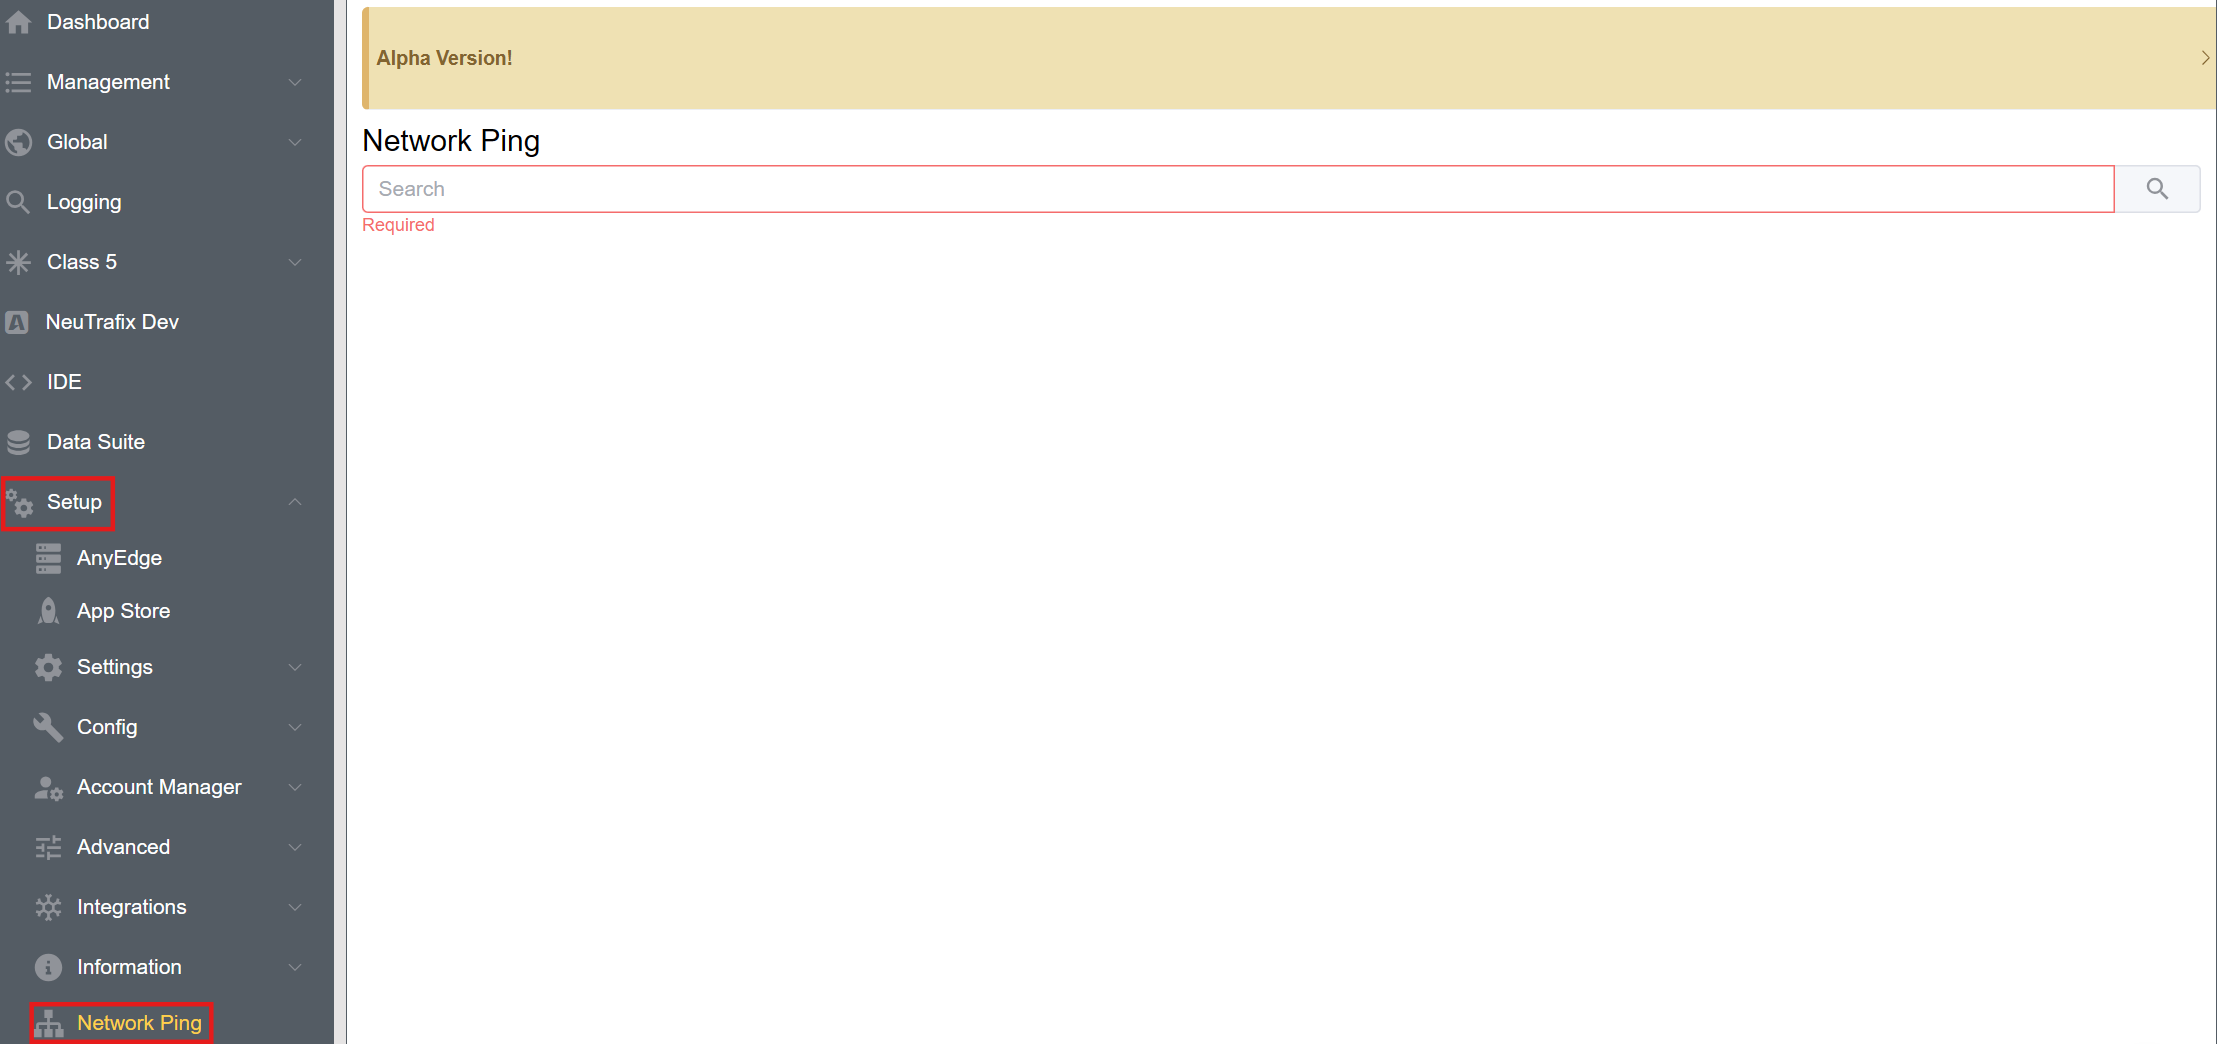
- Enter the IP Address. Click on Search button.
- The results are displayed as shown below.
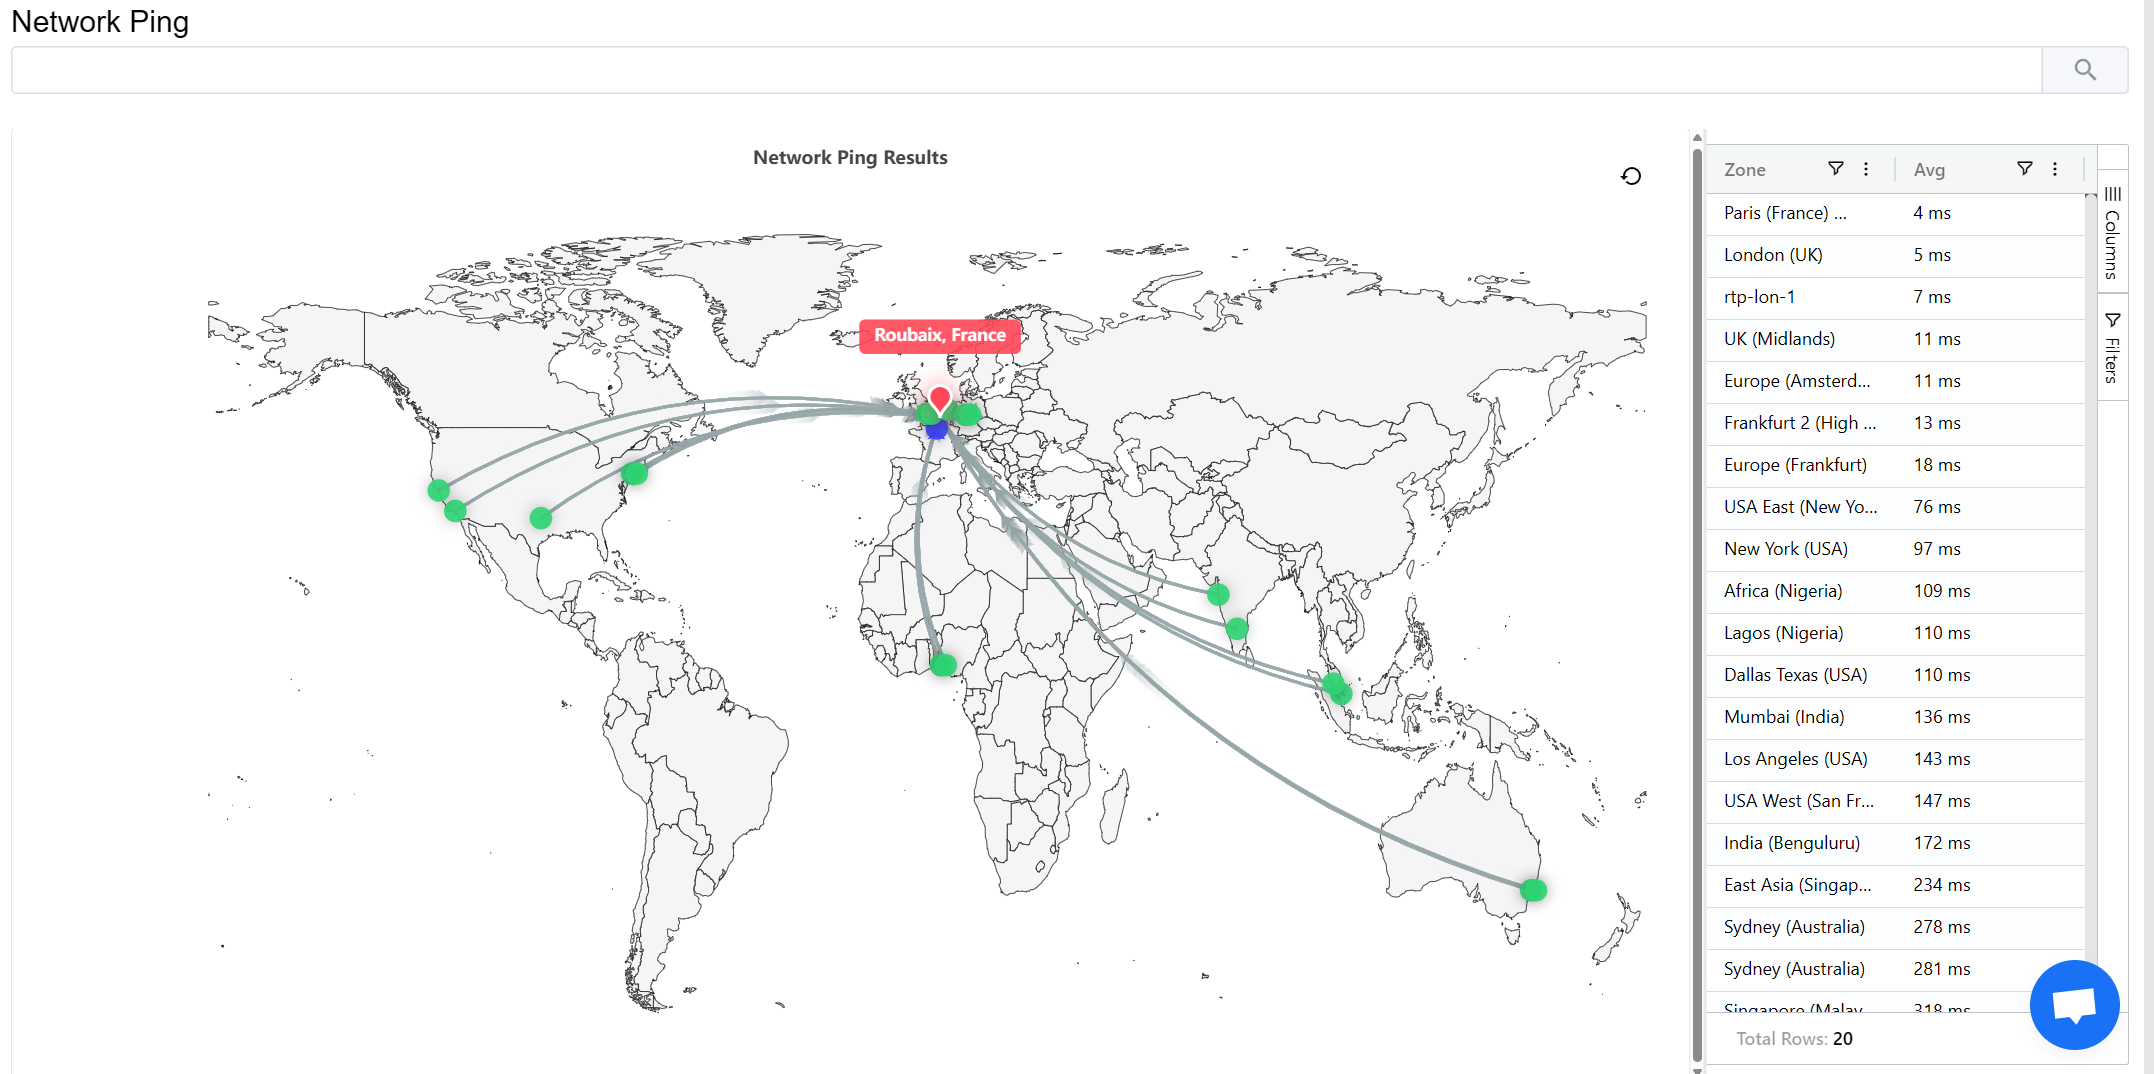
How It Works
When you enter an IP address, the system performs a lookup and displays three key network components:
| Color | Represents | Description |
|---|---|---|
| 🟥 Red Dot | Destination (Entered IP) | The IP address you entered. It’s the endpoint being tested for reachability. |
| 🟦 Blue Dot | AnyEdge Server | The AnyEdge Zone this IP will connect to. |
| 🟩 Green Dots | ConnexCS Zones | Global ConnexCS servers from which the ping tests originate. |
Ping Flow
- The ConnexCS Zone servers send ping requests to the destination IP (red).
- The visual map shows directional flow. The data moving towards the destination.
- Each connection displays a ping turnaround time, showing how quickly each zone reaches the target.
Average Packets / Latency
The Average Packets metric represents the round-trip time (RTT).
Its the duration between sending a ping request and receiving a response.
This helps measure:
- Network delay between servers and destination.
- Performance of the route taken through AnyEdge.
- Stability and responsiveness of the target IP.
Interactive Visualization
- Hovering over any zone (green dot) highlights the corresponding record in the grid panel on the right.
- The grid displays zone names, ping times, and additional connection details.
- The directional lines on the map are animated for clarity, but not real-time path tracers.
- Ping times, however, are updated in real-time.