Dashboard
Document Metadata
Category: Dashboard & Monitoring
Audience: Administrators, Engineers, Support Team
Difficulty: Beginner to Intermediate
Time Required: Approximately 30–45 minutes
Prerequisites: Active ConnexCS Platform account with access to the Customer Portal
Related Topics: Customer Portal Overview, Logging & Call Trace, Analytics & Reporting
Next Steps: Configuring Alerts & Balance Notifications, Detailed Call Stats, CDR Export
The ConnexCS Dashboard provides a real-time overview of active customers, channels, and key system metrics. It includes interactive elements for monitoring traffic, analyzing trends, and customizing data displays.
Overview
-
Displays a summary of Live Channels, Active Customers, Carriers, and Rate Cards.
-
Quick access to essential functions.
-
For detailed account activities, use the Menu System on the left.
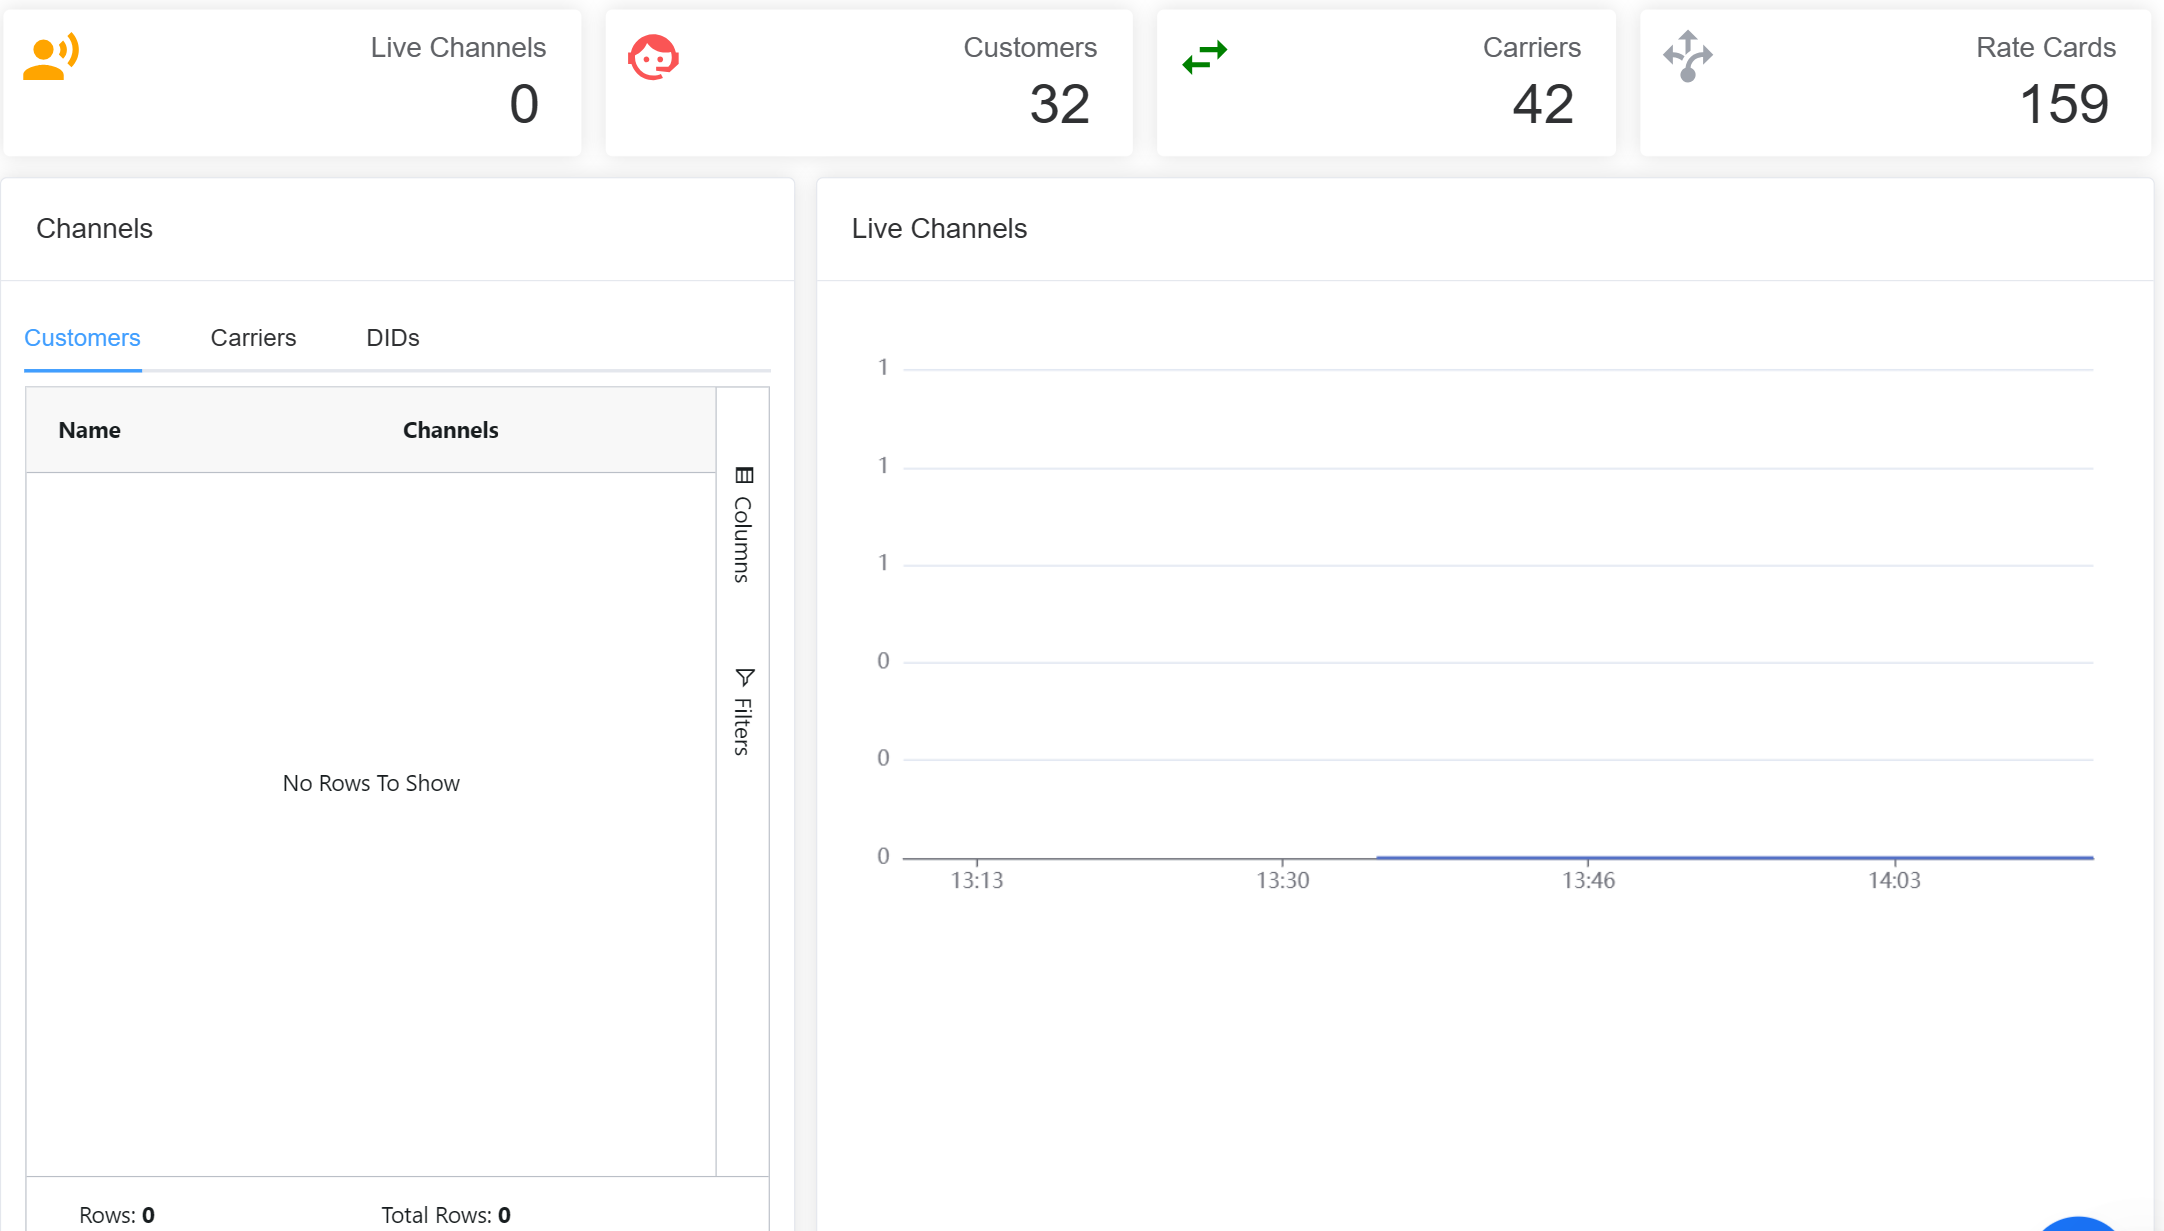
Channels
Table view of active channels for Customers, Carriers and DIDs sorted by Channels in Use (highest and lowest).
Live Channels
Displays the number of active channels in real time through a Graph.
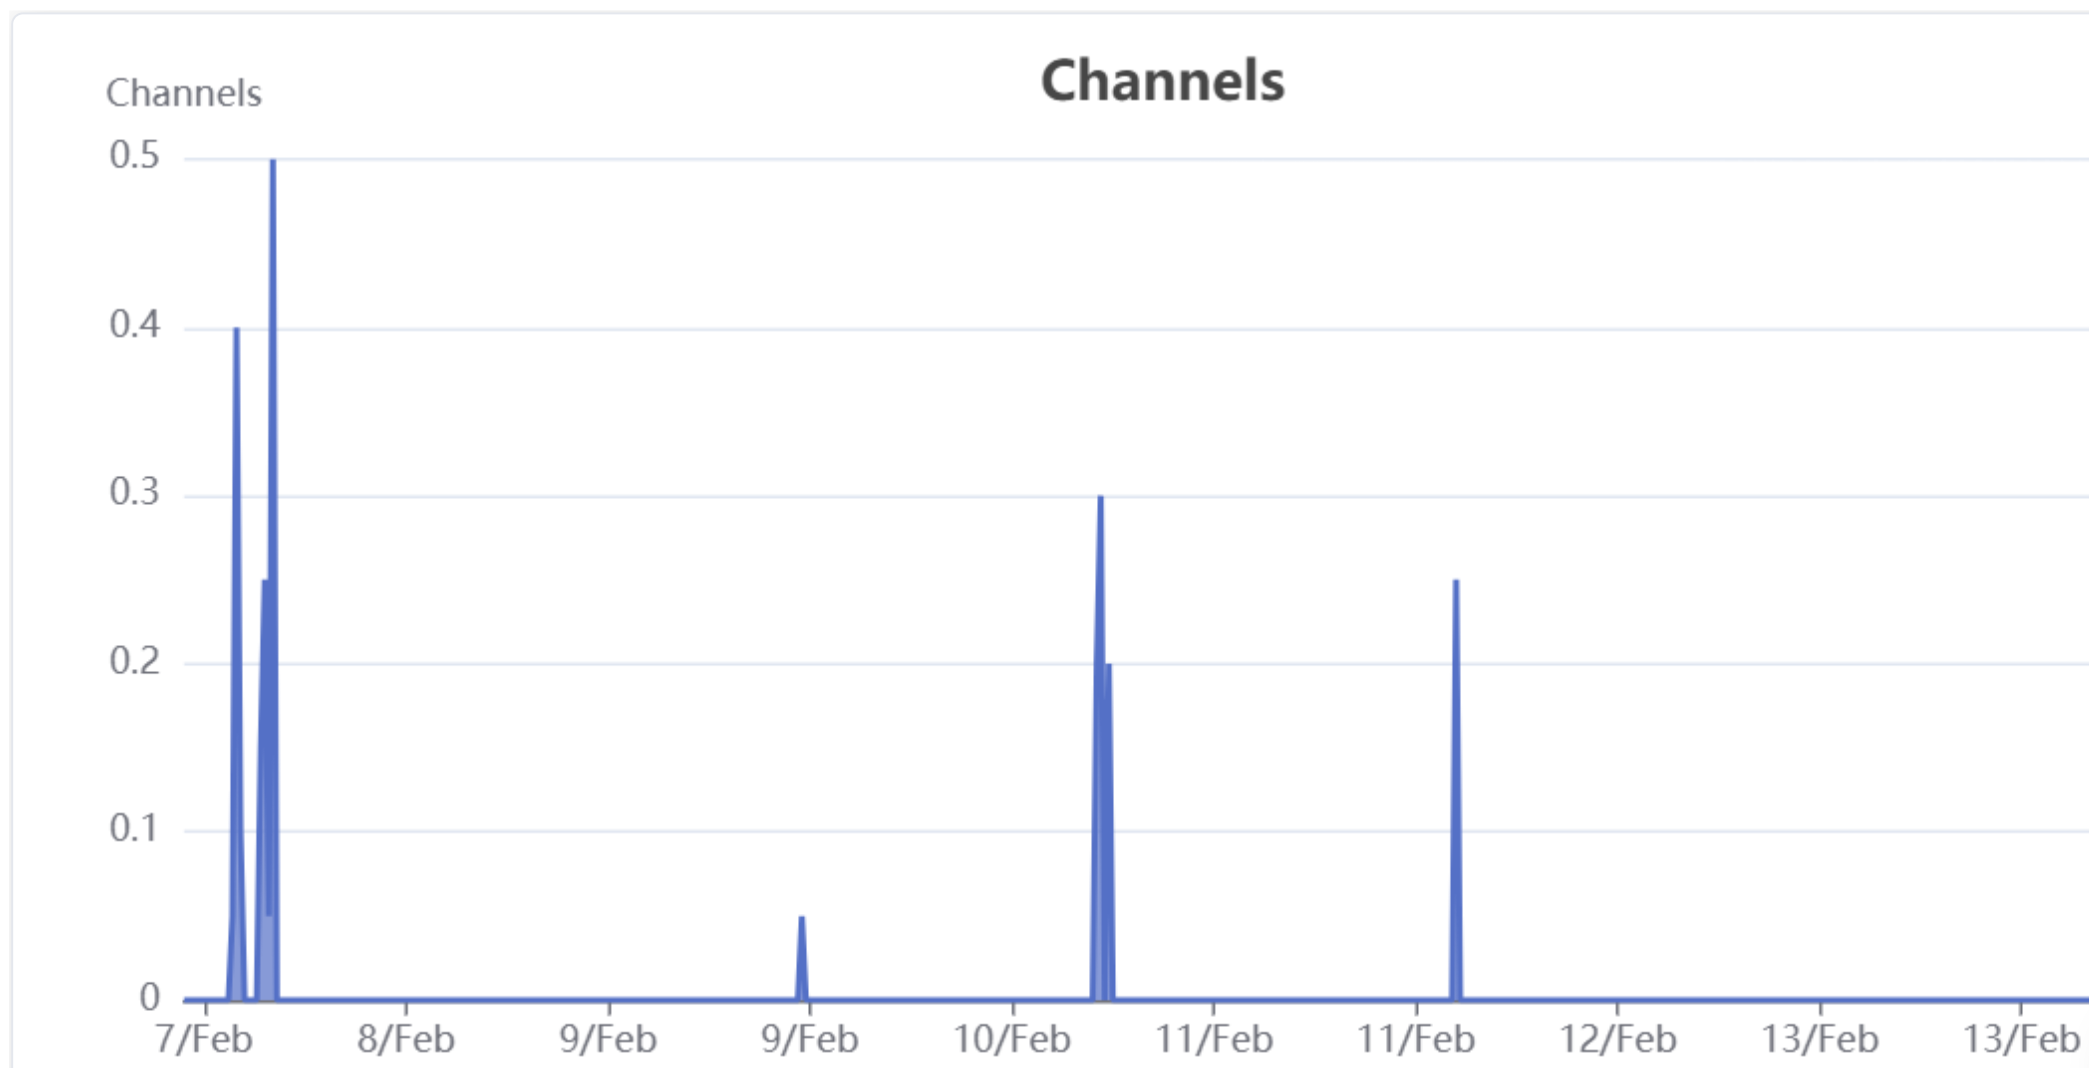
Graphs
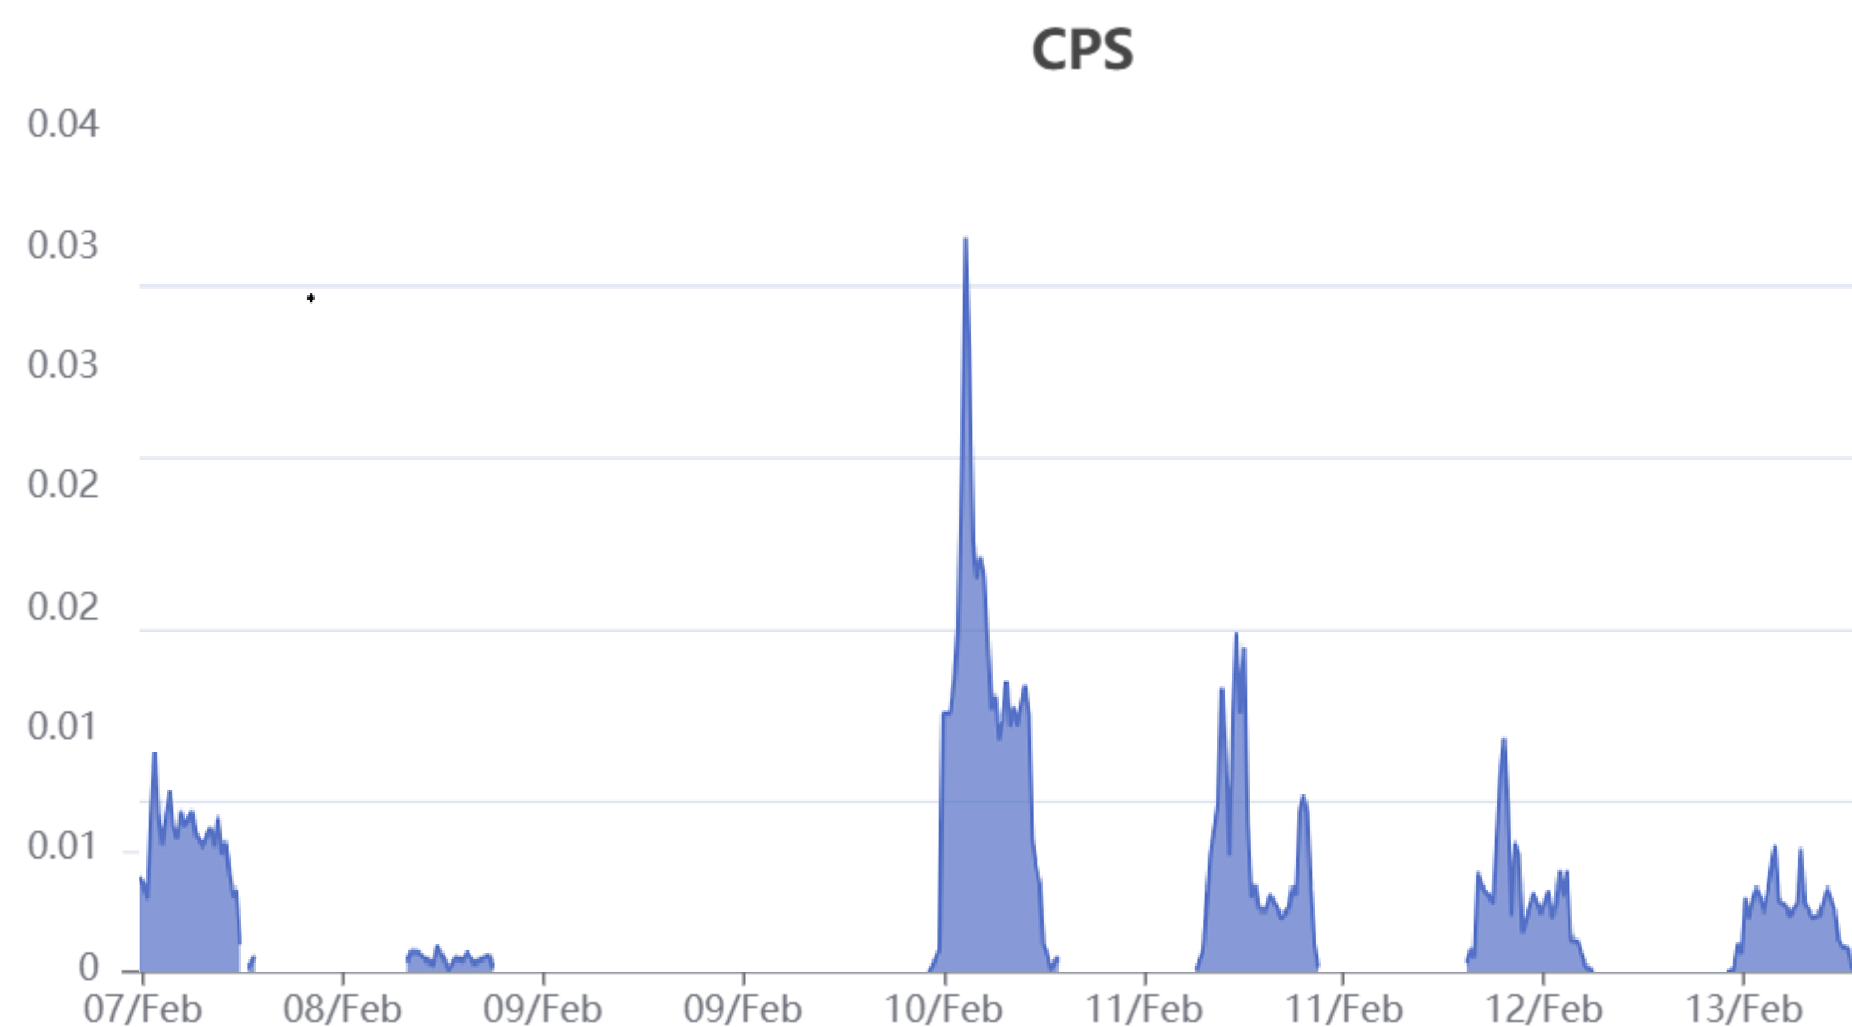
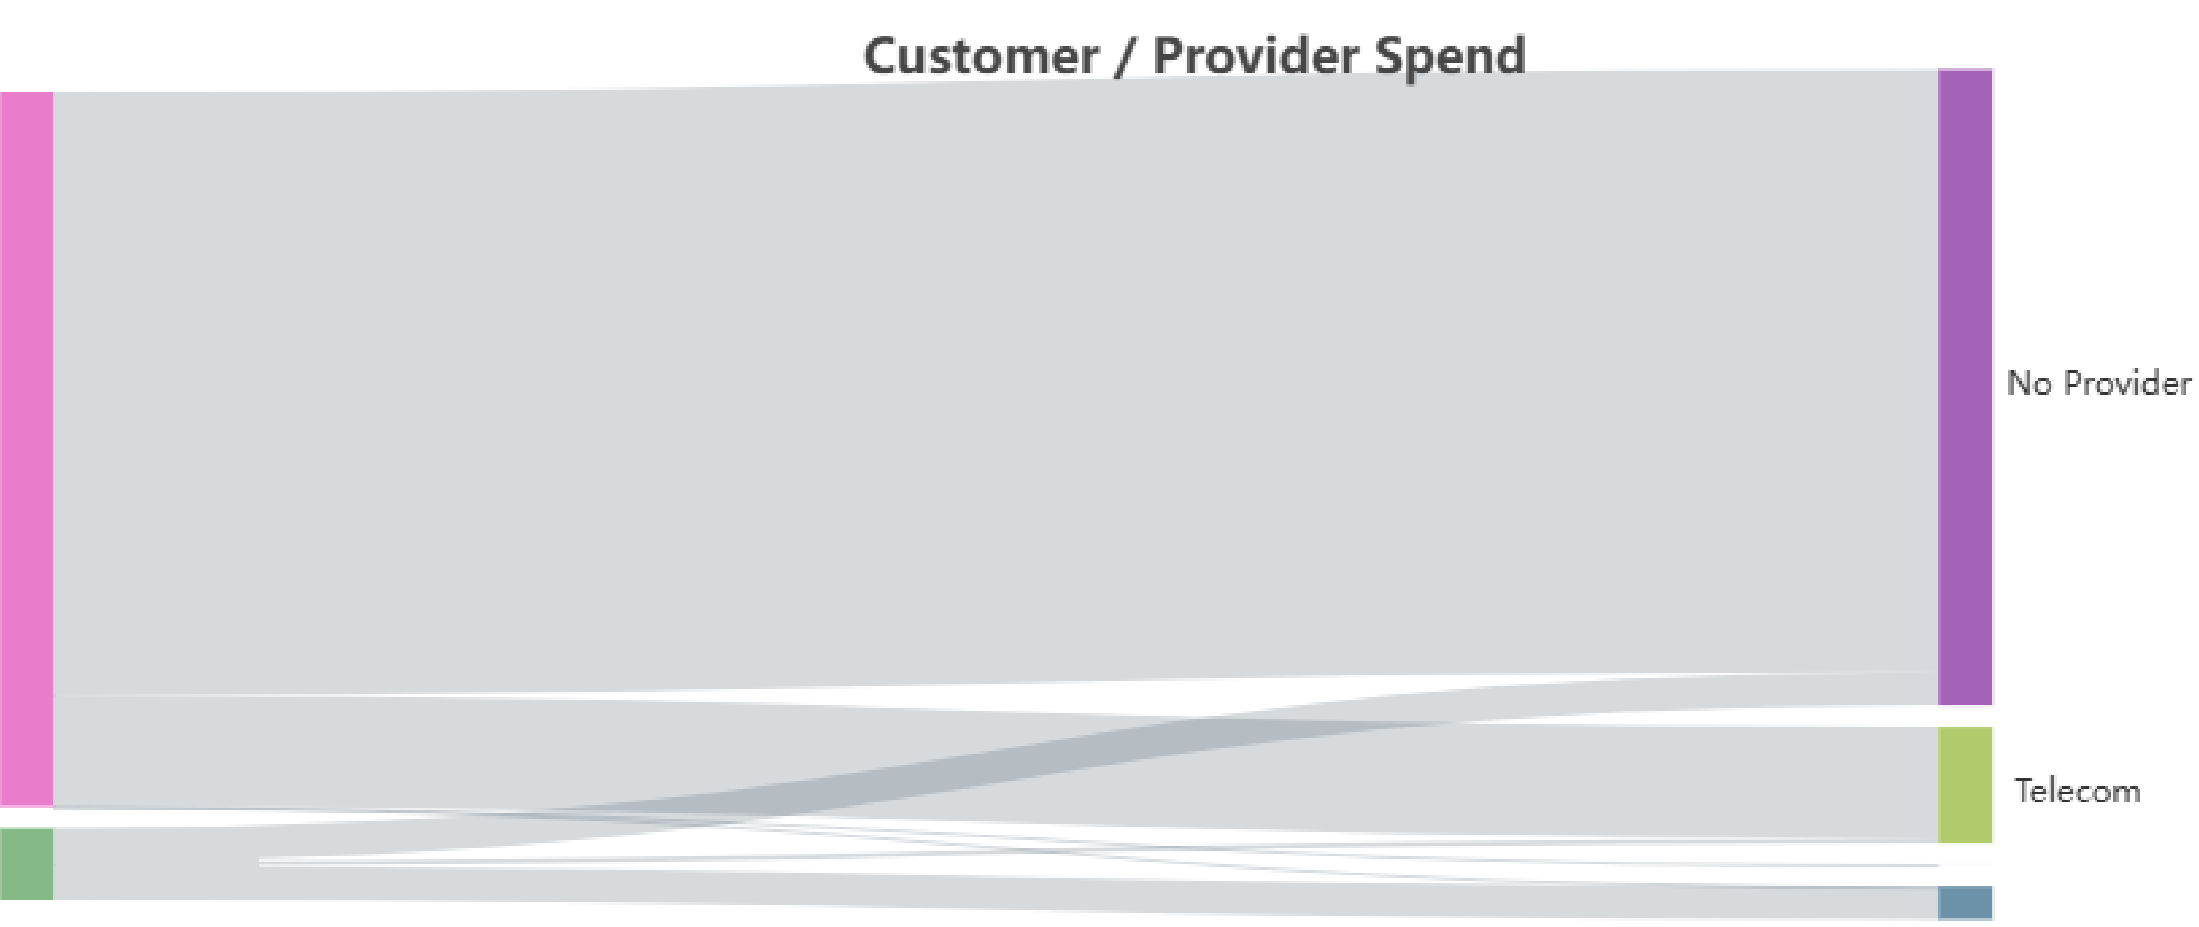
With this new feature, you can view parameters:
- Channels (historical data).
- CPS (calls per second).
- Customer/Provider Spend
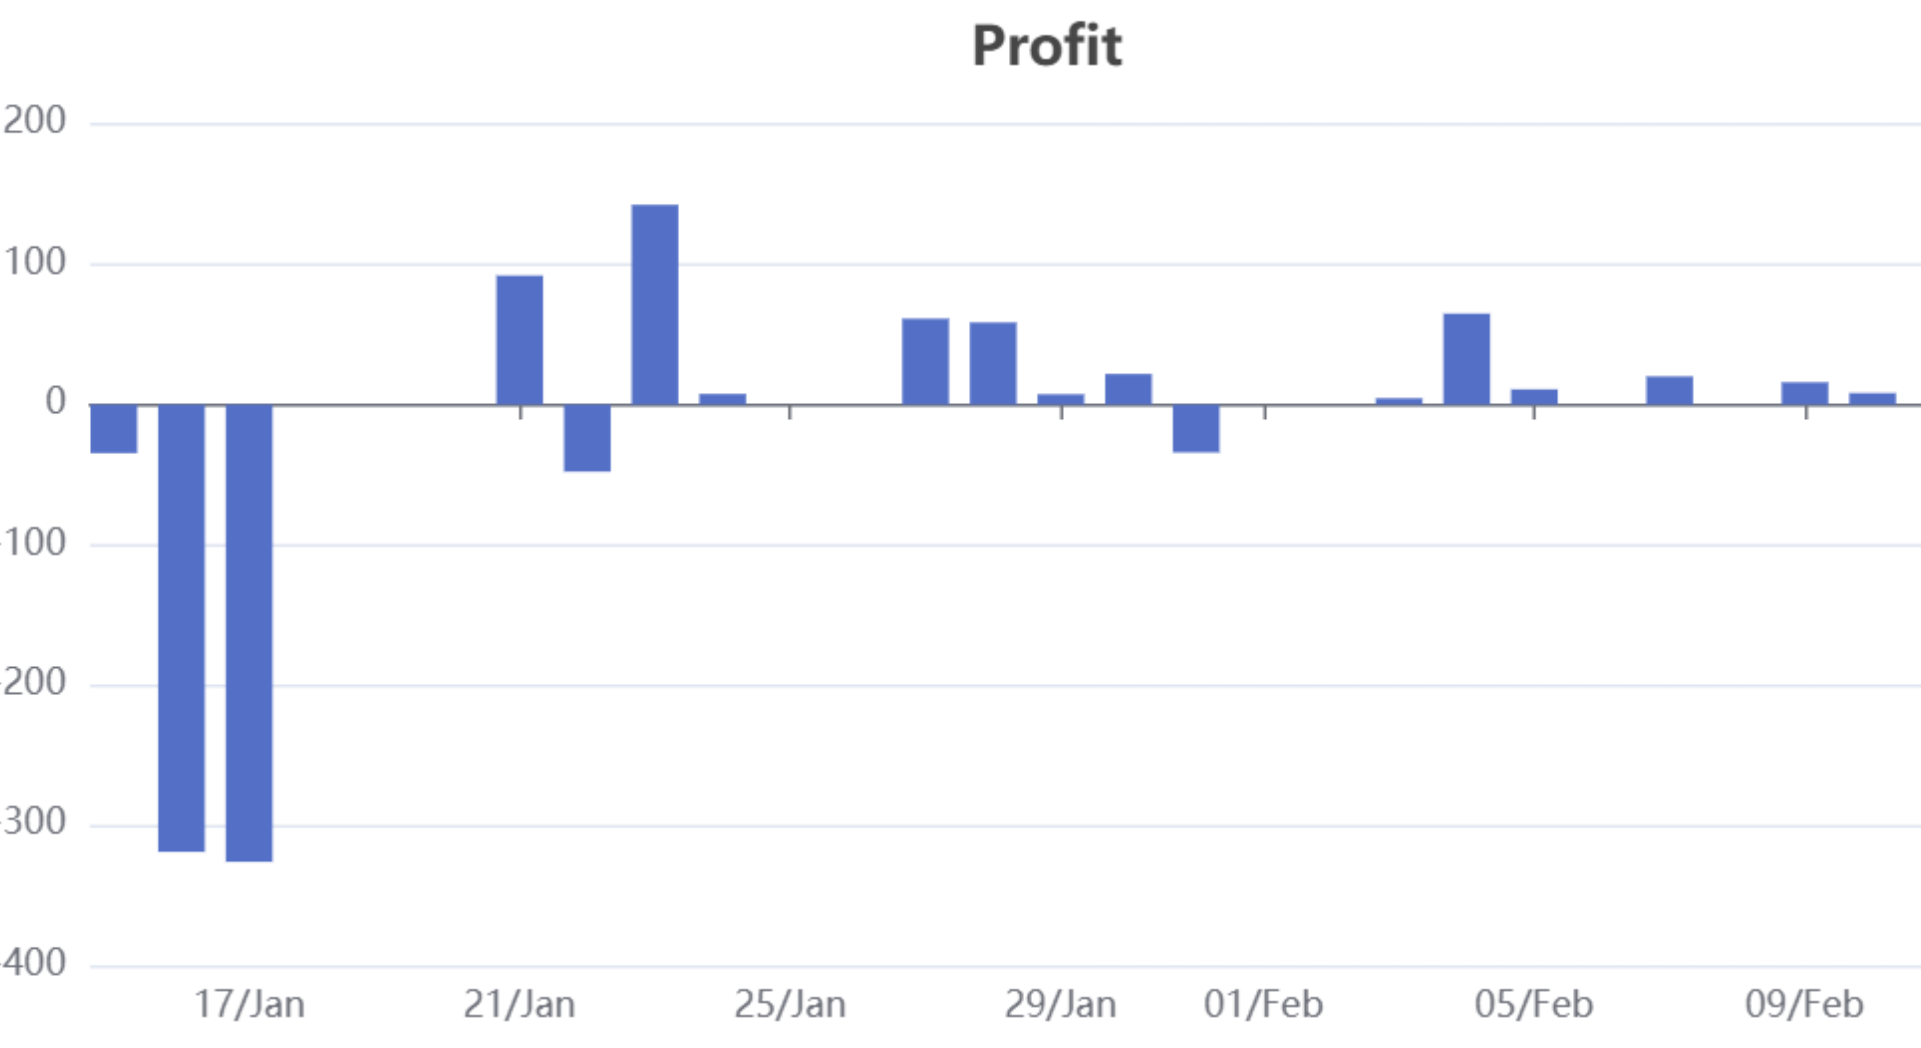
- Profit (daily stats on profit and loss, good for analysis).
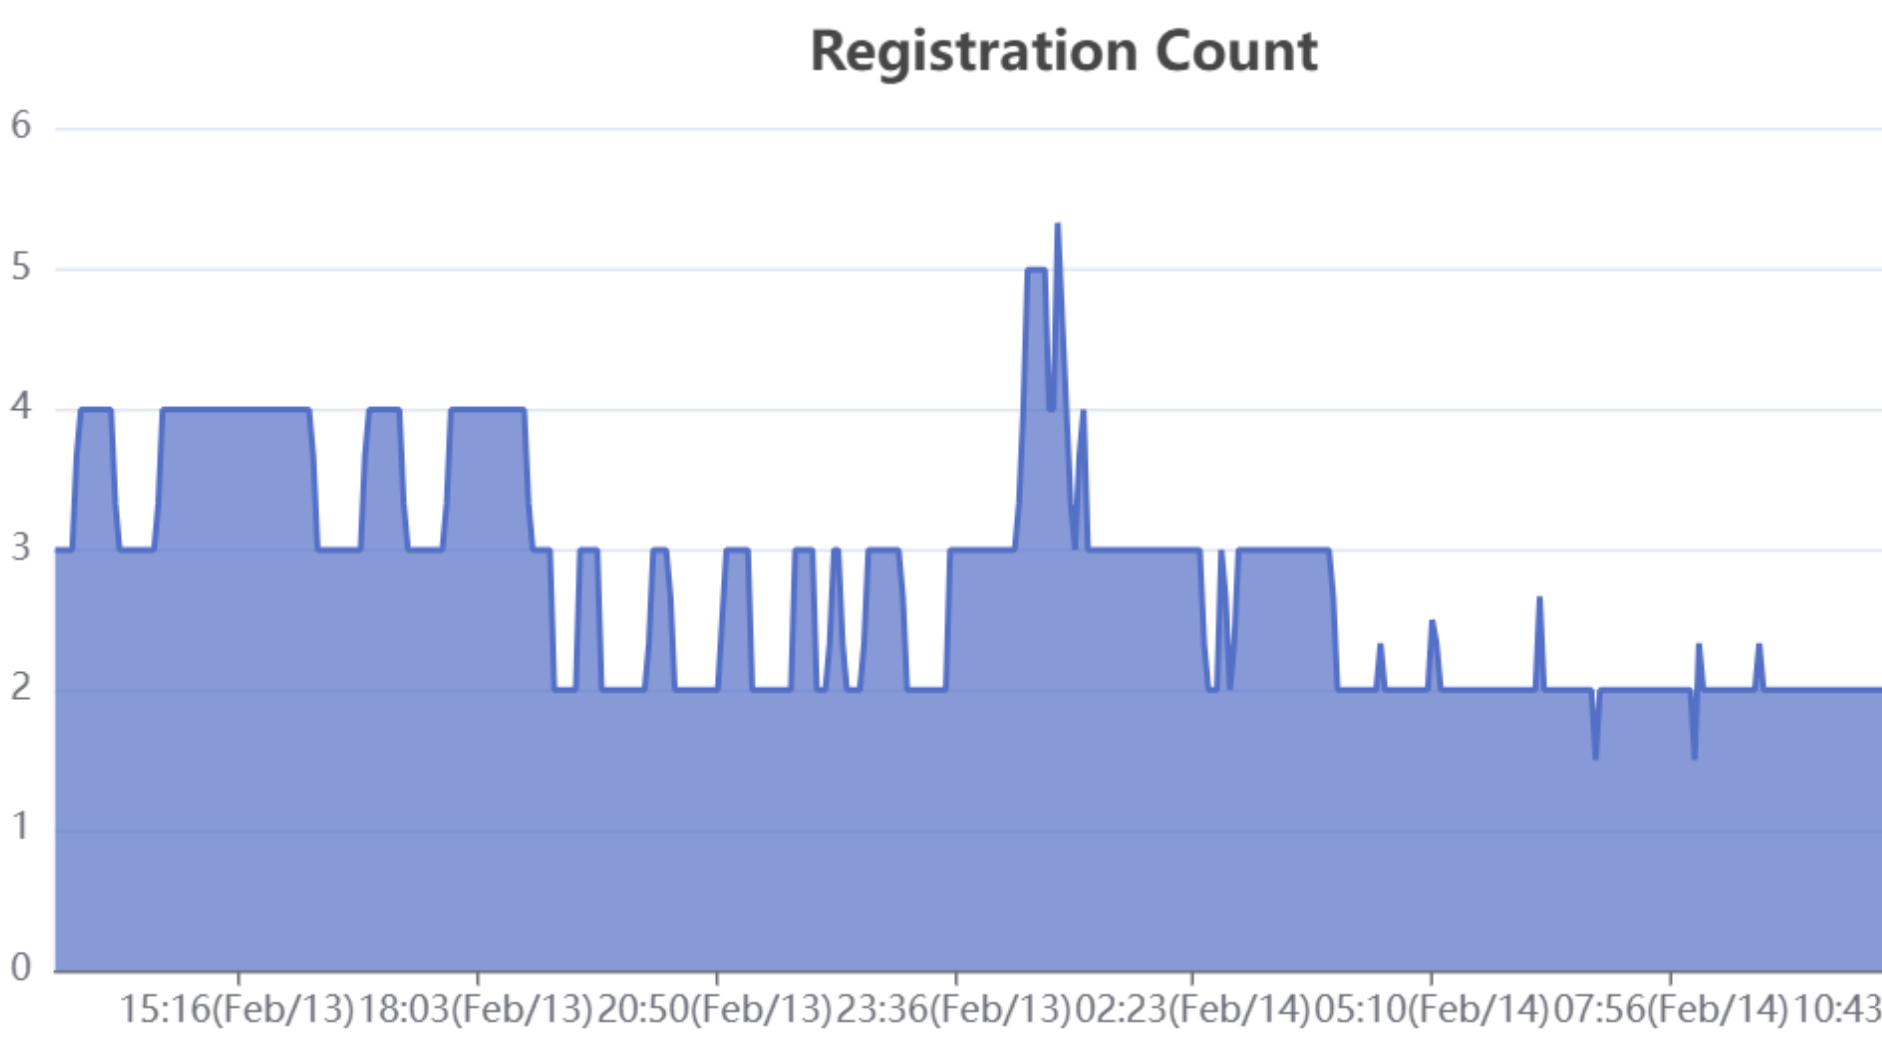
- Registration Count (currently registered end-points).
This information is available for 7 days
Customization
-
Fully Customizable using Custom Pages
-
Users can modify and integrate analytics into the dashboard.
-
New reports and insights can be pushed dynamically.
This structured dashboard guide ensures customers can effectively monitor system performance, analyze data, and customize their experience with ConnexCS.
Download Control Panel Application
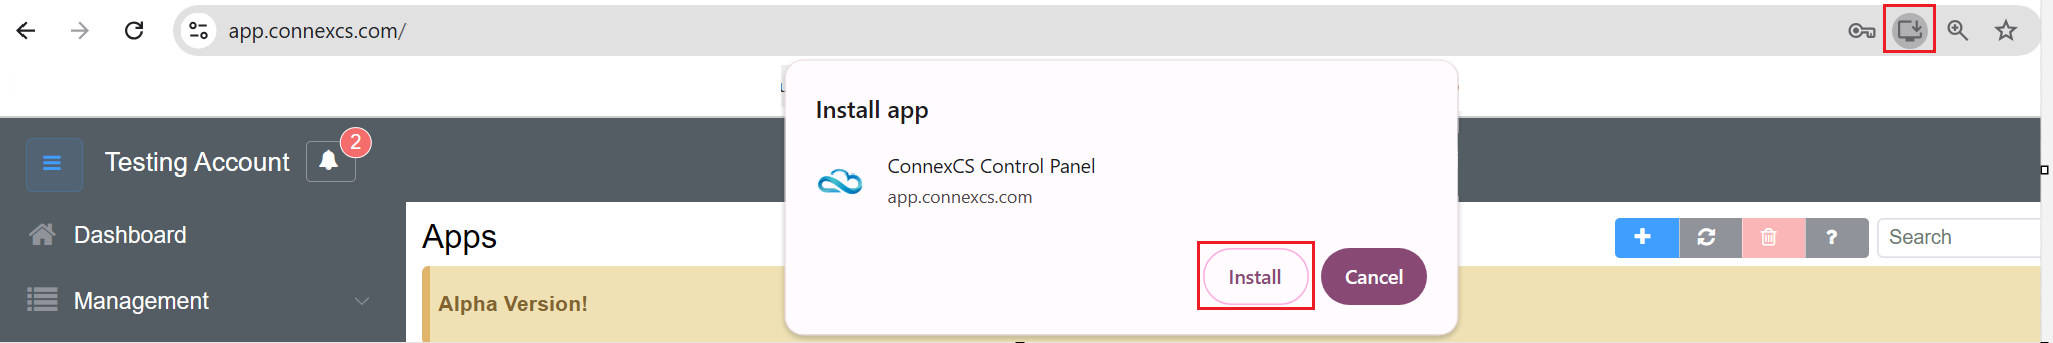
To download our Control Panel Application. Click  on your browser while you are logged into your account and hit Install.
Version of the Control Panel
The Version represents the deployed build or release identifier of the Control Panel currently running for the customer.
It reflects the exact codebase snapshot deployed in that environment.
Purpose
The Version field enables:
- Identification of outdated deployments
- Correlation with known bugs or release notes
- Feature availability verification
- Upgrade or rollback decision-making
- Regression analysis
- Behaviour comparison across deployments
When It Is Used
Version becomes relevant when:
- A feature behaves unexpectedly
- UI inconsistencies are reported
- A newly released feature is not visible
- A previously fixed bug appears again
- Behaviour differs across customers
- Engineering requires build verification
Escalation & Governance Requirements
When handling control panel issues:
- Confirm and log the Version.
- Compare against the latest stable deployment.
- If outdated:
- Confirm upgrade schedule.
- Check if issue is resolved in a newer release.
- If on latest version:
- Escalate as potential new defect.
- Include Version in engineering report.
Version must always be logged in technical escalations
Zone of the Control Panel
Definition
The Zone identifies the infrastructure cluster or server environment where the customer instance is hosted.
It indicates the specific infrastructure region or deployment cluster responsible for serving that account.
Purpose
The Zone field enables:
- Infrastructure-level debugging
- Identification of environment-specific issues
- Correlation of incidents affecting multiple accounts
- Faster routing to the correct DevOps / Network team
- Impact assessment during outages
When It Is Used
Zone becomes relevant when:
- Call routing behaviour is inconsistent
- Performance degradation is reported
- SSL or domain configuration issues occur
- Database or service latency is observed
- Multiple customers report similar symptoms
- Infrastructure alerts are triggered
Escalation & Governance Requirements
When escalating a technical issue:
- Zone must be captured in the support ticket.
- Verify whether other accounts in the same Zone are impacted.
- If multi-account impact is identified, classify as a potential zone-level incident.
- Route to the responsible infrastructure team.
Zone is mandatory metadata for infrastructure debugging.