Dashboard
Document Metadata
Category: Customer Portal / Dashboard Overview
Audience: Administrators, Customer Success, Support Team
Difficulty: Beginner to Intermediate
Time Required: Approximately 15–20 minutes
Prerequisites: Active ConnexCS Customer Portal account with access rights to view the Dashboard module
Related Topics: Customer Portal — Alerts & Notifications
Next Steps: After reviewing the portal dashboard, customise dashboard widgets (key metrics, active sessions, usage trends), bookmark the portal for daily monitoring, and schedule a weekly review of user-access logs and alerts to stay ahead of anomalies
Overview
The Customer Portal provides access to configurations, real-time testing and stats, and more information about your account.
The Dashboard is designed to give you a quick overview of your account activity and call statistics. It includes:
Top of Page Functions

-
Checklist Quick view of outstanding alerts (e.g., email/mobile verification reminders).
-
Time Zone Click on the Date/Time box to select the Time Zone for your site.
-
Channel Count Total Live Channels presently in use and total configured Channels.
-
Account Balance Displays the current account balance and a link to make a payment. Click here to know more about Payments.
-
Account Use this to view your Company Profile, view and update your personal Profile, Change Password or Language, or Log Out.
Setup Personal Profile
To setup, click your name in the upper right corner and select Profile.
The page is divided into two main sections:
- Company Profile (Account-level information)
-
My Profile (User-level information)
-
View
Company Profiledetails such as Company Name, Contact Name, Currency, Debit Limit, Tax, Paypal. -
View
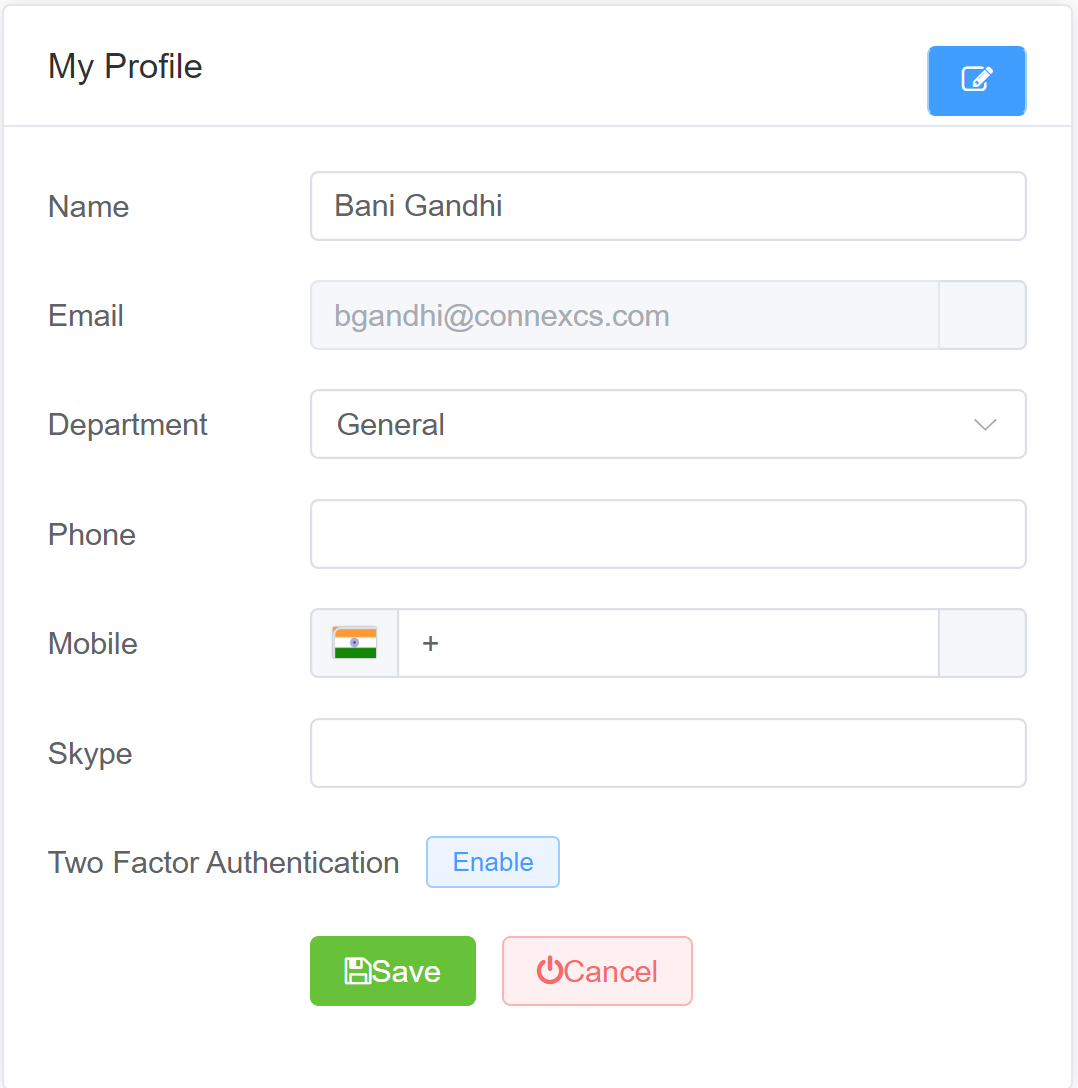
My Profiledetails. You can only edit the Name, Email, Department, Phone, Mobile fields.
-
Two Factor Authentication: This adds additional security against password guessing and theft, including brute force attacks (details here).
To configure this, click Enable and follow prompts for QR code. You must install a 2FA/TFA app on your phone.
Graphs
Below is the Current Customer account usage on four default Graphs.
| Graph | Description |
|---|---|
| Live Channels | Displays the number of active concurrent calls over time |
| ASR (Answer Seizure Ratio) | Displays the percentage of successfully connected calls over time |
| ACD | Shows the average duration of connected calls over time |
| DTMF | The DTMF graph shows the volume or percentage of DTMF (keypad tone) activity during calls over time |
Summary
The Summaries of calls in Live (last 24 hours), Daily, and Monthly formats are all displayed in 24-hour UTC. This data updates hourly.
You can perform the following Functions with this data:
- Sum and Average: Select several cells in a column to get the sum and average values (not a true average, but an average of averages).
- Export Data: Select data from several columns and rows, then right-click to
Copy,Copy with Headers, orExport.
Data used for billing
For billing purposes, consider the data found in the Customer Summary section as valid. Although the same information might be at other locations, you shouldn't use it for billing.
Internal Number Block
Internal Number Block to define the range of numbers a Customer can use for setting up SIP Extensions.
Without defined Internal Number Blocks, there is the risk of a Contact attempting to use an extension that's already in use by another Customer or Contact.