Report
Document Metadata
Category: Reporting & Analytics / Standard Reports
Audience: Administrators, Engineers, Billing & Product Teams
Difficulty: Intermediate
Time Required: Approximately 30–60 minutes
Prerequisites: Active ConnexCS account with Reports access; familiarity with call metrics (ASR, ACD), traffic segmentation, and prefix/rate-center concepts.
Related Topics: Rate Card Overview, Analytics & Custom Reports
Next Steps: Navigate to the Report module, select the appropriate report type (e.g., Breakout, USA Calls, Per Number), apply filters (date range, customers, providers), generate the report, then use exports or schedule email delivery for continuous monitoring.
Management Report
View and Download Reports that provides extensive insights on historical data such as by Customers or Provider routes, Dual-Tone Multi-Frequency (DTMF) Cost, and Per Number metrics.
The ability to Schedule reports adds automation for frequent data requirements.
Creating additional reports
The Developer Analytics section of ConnexCS lets providers to manage these reports and create new reports.
Breakout
The Breakout report lists account customers with associated profits, and relevant data such as how much each customer costs, and the cost, the Answer-Seisure Ratio (ASR), and the Average Call Duration (ACD), etc.
The information here is from a processed CDR and considered as "billing accurate," meaning the billing for the customers uses this data.
- Use the fields at the top of the page to filter by Customers and Providers, and by date range. Each individual column can also filter the grid directly.
- Use the Columns and Filters to manage data presentation.
- Enable Pivot Mode (check box at the top of Columns) to setup Row Groups and Values for additional report customization.
Example: Drag Provider and Provider Destination to Row Groups to see which routes a provider is using for your calls.
Refreshing the Breakout Report
Remember to click Refresh each time parameters change to ensure you see the most recent selections onscreen.
When refreshing the list (typically done after you revise the filtering parameters), use the Report Refresh and not the Browser refresh button.
Dual Tone Multi Frequency
Use the Dual Tone Multi Frequency (DTMF) report for customers that send DTMF (for example, voice broadcast systems). This allows you to establish the cost-effectiveness of a route and the cost per DTMF digit.
Reports
Presently, this provides the same functionality and options as the individual Breakout and DTMF reports. When new reports materialize, it will replace the old ones. This page has the same Pivot and Filtering functionality as the Breakout report.
Per Number
This report displays metrics for a specific number. It's specifically useful if you get a complaint about people dialing a specific number.
Select the number and define the time (max 6 months) to generate a list of all calls for that number, along with call details.
Click Numbers to search for several numbers.
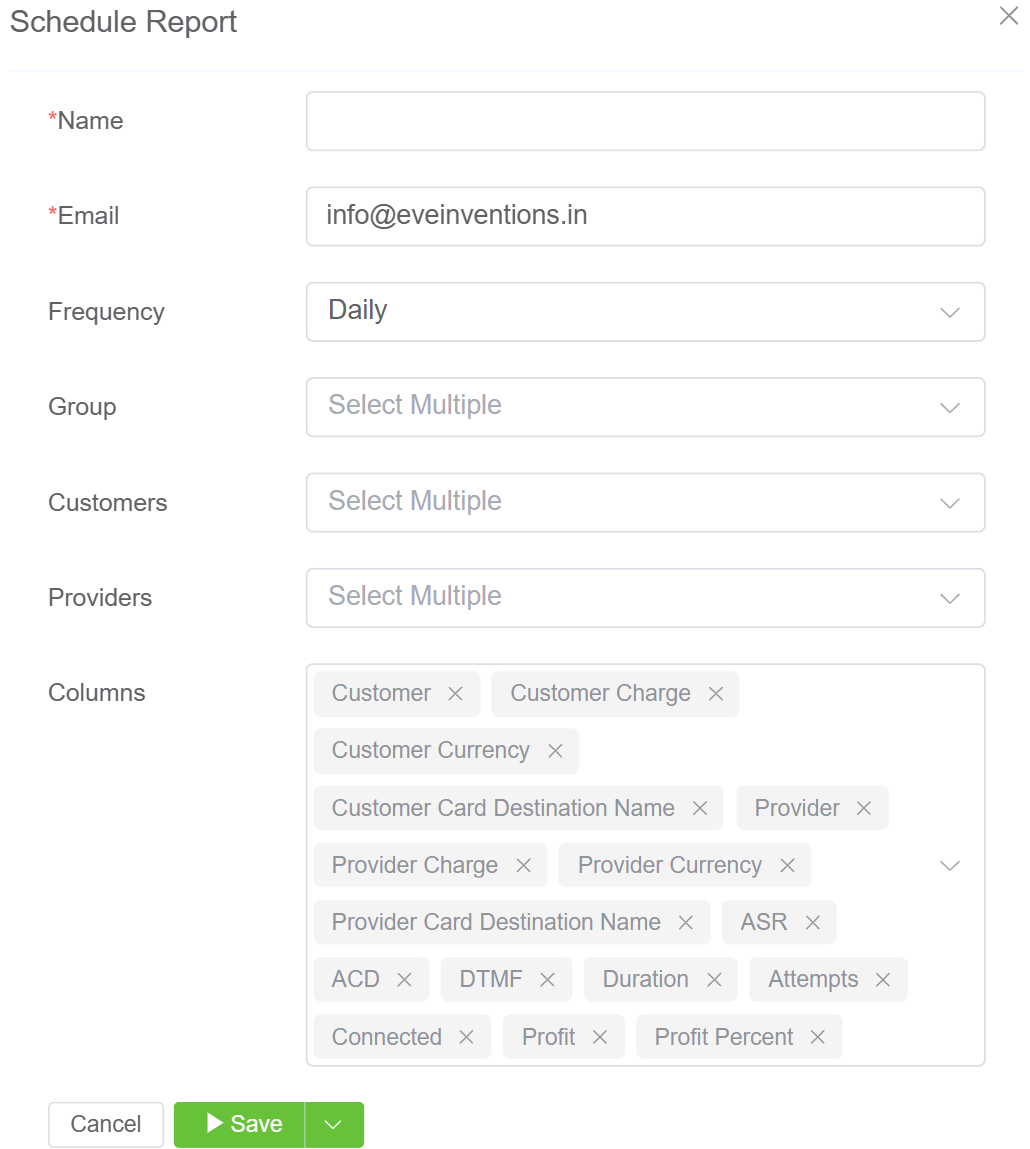
Schedule Report
Set a Schedule to email the Breakout Report at designated intervals. To schedule a breakout report, click .
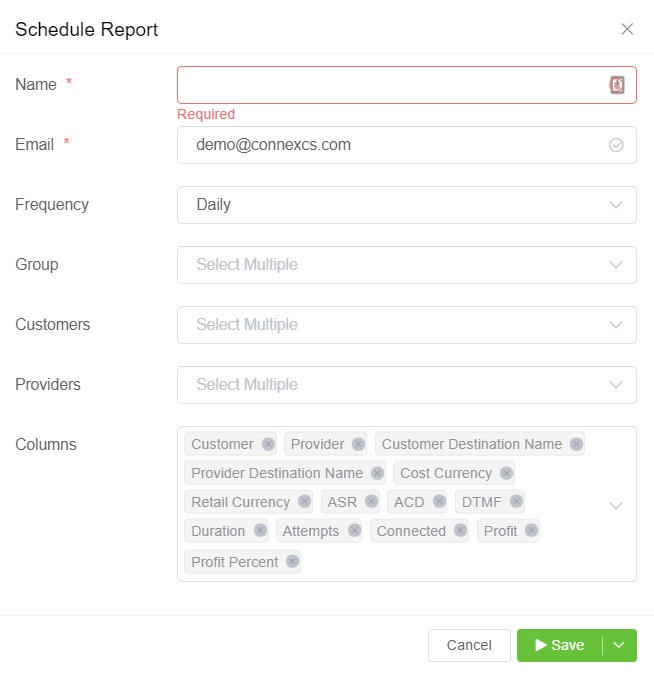
- Name: The report schedule.
- Email: The report recipient.
- Frequency: You can schedule the report; Daily, Weekly or Monthly.
- Group: Select one or more ways to group the data.
- Customers: Select one or more, or leave it blank for all Customers.
- Providers: Select one or more, or leave it blank for all Providers.
- Columns: Select the columns to include in the report.
Click Save to schedule the Report.
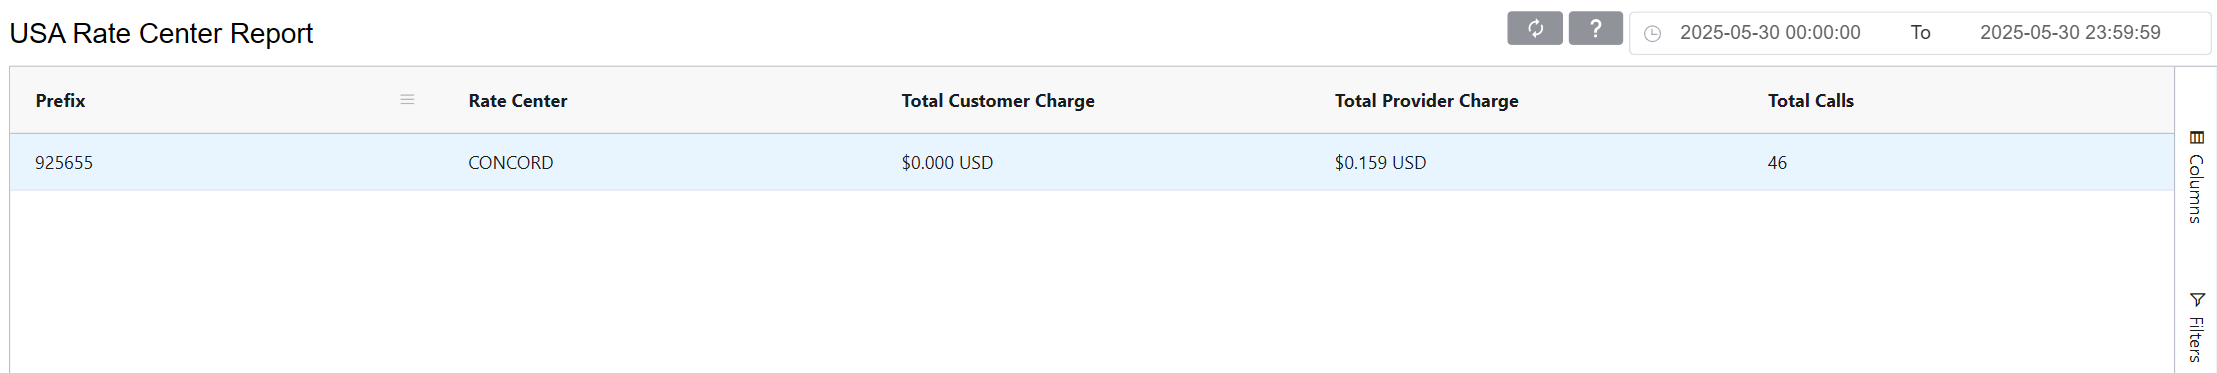
USA Rate Center
In the United States, different states (or regions) have varying call rates. This report provides insights into the volume of calls originating from each rate center. A rate center represents a specific geographic region for telecommunications billing and routing purposes.
The report gives information of the Prefix, Rate Center (region), Total Customer Charge, Total Provider Charge, and Total Calls.
USA Calls
This report provides a breakdown of total call minutes segmented into three categories:
-
Intra (On-net) Calls: Minutes for calls made within the same network or account.
-
Inter (Off-net) Calls: Minutes for calls made between different networks or accounts, but within the same country.
-
International Calls: Minutes for calls made across different countries.
The report helps carriers and customers separate traffic usage by regulatory category, providing clarity for billing, compliance, and routing optimization in the U.S.
Now lets go through the USA Calls report dashboard:
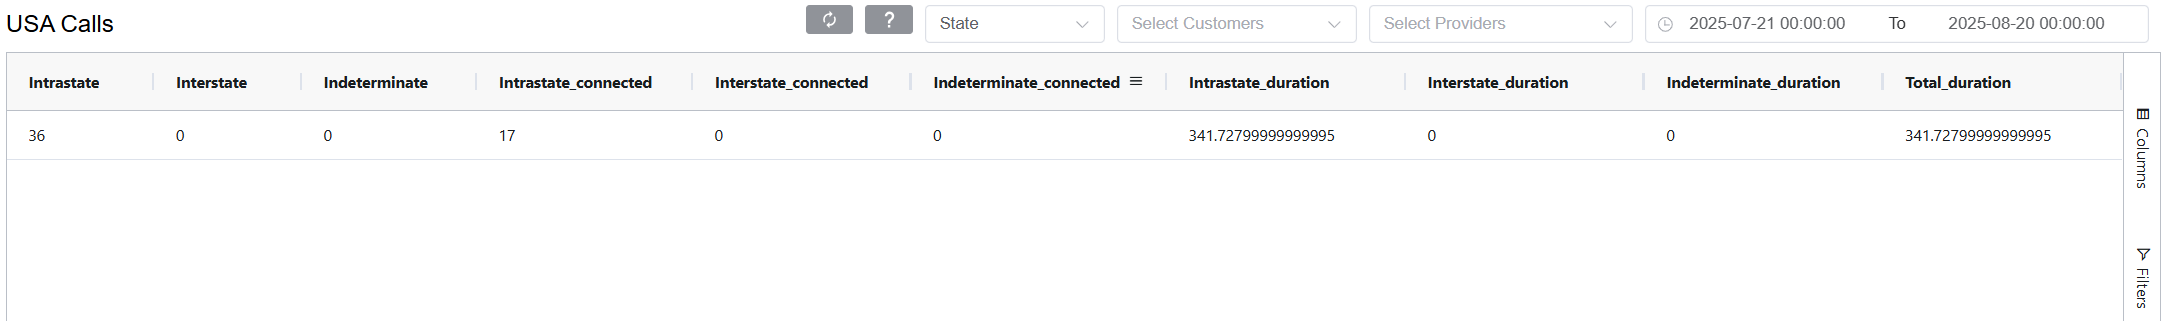
- Type: Select type of report as
StateorLATA.- State: Calls rated based on the state where they originate or terminate.
- LATA (Local Access and Transport Area): Calls rated based on Local Access and Transport Area boundaries.
- Select Customers, Select Providers from the selector drop-down.
- Use the date selector to define the specific date range for which the report should be generated.
- The report consists the following key fields:
- Intrastate: Total number of calls placed within the same U.S. state (origin and destination are in the same state).
- Interstate: Total number of calls placed between different U.S. states (origin in one state, destination in another).
- Indeterminate: Total number of calls where the system cannot definitively classify the call as Intrastate or Interstate (e.g., missing or ambiguous caller/callee location data).
- Intrastate_connected: Number of successfully connected calls within the same state.
- Interstate_connected: Number of successfully connected calls between different states.
- Indeterminate_connected: Number of successfully connected calls where the call classification is unclear.
- Intrastate_duration: Total duration (in minutes or seconds, depending on system configuration) of connected Intrastate calls.
- Interstate_duration: Total duration of connected Interstate calls.
- Indeterminate_duration: Total duration of connected Indeterminate calls.