Connexamine
Document Metadata
Category: Tools / Connexamine
Audience: Network Administrators, VoIP Engineers, NOC Engineers, Support Team, Customers Troubleshooting SIP Connectivity
Difficulty: Intermediate
Time Required: Approximately 20–30 minutes
Prerequisites: Linux system with root or packet capture permissions, basic understanding of SIP signalling, call setup flow, and network troubleshooting
Related Topics: SIP Signalling, Call Setup Analysis, Class 4 Services, sngrep, Network Diagnostics
Next Steps: Install Connexamine, run Interactive mode to analyze live call setup, or configure Daemon mode for continuous monitoring and remote diagnostics through ConnexCS.
Global ConnExamine
Overview
Connexamine is a lightweight SIP call-setup inspector built by ConnexCS.
It watches outbound SIP INVITEs on a host — a PBX, a session border controller, a trunk gateway — and tells you, in plain terms, how long call setup is taking and where it's failing: how fast the far end acknowledged the INVITE, how long it took to start ringing, and how long it took to answer.
ConnExamine is purpose-built to rapidly diagnose call setup delays and failures on a connection. Instead of functioning as a full protocol analyzer, it focuses on the key metrics required to troubleshoot SIP call establishment.
Connexamine is designed to work with the customer's own server — it isn't limited to servers hosted by ConnexCS. If the customer runs a server outside of ConnexCS's infrastructure (for example, a dialer server), Connexamine authenticates to it by entering that server's proxy details.
What problem it solves- Simplifying SIP Troubleshooting
Most SIP issues that get escalated to a provider aren't caused by complicated protocol errors. They're usually first-hop connectivity problems — things like:
- A trunk that's slow to send back
100 Trying - A carrier that takes too long to send
180 Ringing - A destination that never sends any SIP response at all, and just times out
Normally, tracking down these issues means manually digging through call traffic with tools like sngrep, tcpdump, or Wireshark — capturing the SIP packets yourself and tracing each INVITE through to its response, call by call.
Connexamine does this correlation automatically. It skips the manual packet-tracing and surfaces just the handful of metrics you actually need to diagnose this kind of problem.
| Metric | Measurement | Purpose |
|---|---|---|
| Trying Time | Time from INVITE to 100 Trying |
Measures how quickly the destination acknowledges the SIP INVITE, indicating whether the far end is reachable and responsive |
| Post Dial Delay (PDD) | Time from INVITE to 180 Ringing or 183 Session Progress |
Measures the time taken before the destination starts ringing or provides early media to the caller |
| Ring Time | Time from 180/183 to 200 OK |
Measures how long the call rings before it is answered |
| Final Disposition | Final SIP response code or timeout stage | Indicates the final outcome of the call, including the SIP response code returned or the stage at which the call timed out without receiving a response. |
Comparision with sngrep and similar tools
| ConnExamine | sngrep / generic SIP capture tools | |
|---|---|---|
| Audience | Support staff, junior NOC engineers, customers troubleshooting their own connection | Experienced SIP/telecom engineers |
| Scope | Outbound call setup on UDP/5060 only | Full SIP traffic, all transports, all dialog types |
| Output | Pre-computed timing metrics with color-coded pass/fail | Raw call flows and message dumps you interpret yourself |
| Primary use case | "Is this connection healthy? Where exactly is it slow or failing?" | General-purpose SIP debugging, deep packet-level inspection |
| Continuous/remote use | Yes — daemon mode reports to ConnexCS for ongoing monitoring | No — interactive, on-box, session-by-session |
ConnExamine is deliberately narrower and more opinionated than a general SIP capture tool.
Benefits
- Enables continuous monitoring of call setup performance instead of one-time troubleshooting sessions.
- Eliminates the need for customers to reproduce issues while support engineers monitor an interactive session.
- Streams real-time call setup metrics to the ConnexCS backend for ongoing analysis.
- Provides per-destination performance metrics, making it easier to identify issues with specific carriers or trunks.
- Collects failure samples to help diagnose intermittent or recurring call setup problems.
- Reports host health information, including CPU, memory, disk usage, and system load, to distinguish network issues from server performance problems.
- Gives ConnexCS support continuous visibility into connection health through the ConnexCS portal.
- Bridges the gap between interactive, on-demand debugging and long-term remote monitoring, enabling faster issue detection and resolution.
It doesn't aim to replace sngrep for deep protocol debugging (call transfers, re-INVITEs, media negotiation, non-INVITE dialogs) — it aims to get a first-hop connectivity problem diagnosed by someone who isn't a SIP specialist, in minutes, without needing to learn how to read a SIP ladder diagram.
How to use ConnExamine?
Installation of ConnExamine on your server
-
Go to the server to run the following script:
curl -fsSL https://cdn.cnxcdn.com/connexamine/install.sh | bash -
Run the folllowing command to enter the
Deamon Modefor continuous monitoring, reports to your provider:sudo connexamine --auto -
This will generate the
Code/Daemon Tokento be used in theClaim Boxfor authentication purposes.
The two modes
ConnExamine runs in one of two modes, selected at startup:
- Interactive mode (
default) — a live terminal session for hands-on debugging. - Daemon / auto mode (
--auto) — an unattended background service for continuous monitoring, reporting to ConnexCS.
Note: These modes run on the server terminal.
Interactive mode
This is the default mode. Run the program to see calls as they happen in a simple, color-coded table.
Note: Every call is color-coded (good / average / poor) against sensible defaults, so a non-specialist can glance at a terminal and see a problem — no protocol expertise required to interpret it.
Use the following to start the interactive mode on the server terminal:
sudo connexamine
Typical use
A support engineer or customer runs this directly on the box while reproducing or observing a problem, watches call setup timings scroll by in real time, and immediately sees which stage (Trying / PDD / Ring) is slow or timing out, and against which SIP response code.
     UTC Date/Time      │   Trying Time   │      PDD      │    Ring Time    │       SIP Code - Reason        │ Call-ID
                        │   FROM Number   │   TO Number   │                 │                                │
═══════════════════════════════════════════════════════════════════════════════════════════════════════════════════
2026-07-29 01:03:20.219 │         1023 ms │       5000 ms │        15000 ms │ 200 - OK                       │ abc123@...
                        │    +15551234567 │    +15559876543 │                 │                                │
Key options:
| Flag | Purpose |
|---|---|
-i, --interface <name> |
Network interface to capture on (default: any) |
--trying-timeout, --pdd-timeout, --ring-timeout |
Thresholds (ms) at which a stage is considered a timeout rather than just slow |
--destination-ip <ip> |
Only show calls to a specific destination |
--sip-code <code> |
Only show calls that ended with a specific final SIP response code |
--debug |
Verbose packet-processing output |
--test-mode |
Simulate call traffic instead of capturing — no root/pcap needed, useful for a quick demo |
Interactive mode is entirely local: nothing is sent off the box. It ends when you exit the process (Ctrl+C).
Daemon mode (--auto)
Daemon mode runs the same capture and analysis engine unattended, in the background, and streams the resulting metrics to a ConnexCS-operated endpoint instead of a terminal.
It turns a one-off debugging session into continuous monitoring of a customer's connection, so ConnexCS support can see call-setup health on an upstream trunk over time — without anyone needing to be logged into the box, running the tool, or reading its output.
Use the following to start the deamon mode on the server terminal:
sudo connexamine --auto
Commands for the terminal
| Command Name | Example |
|---|---|
sudo connexamine |
Interactive mode- live terminal debugging |
sudo connexamine -i eth0 |
Specific interface |
sudo connexamine --trying-timeout 3000 --pdd-timeout 15000 |
Custom timeouts |
sudo connexamine --auto |
Daemon mode (continuous monitoring, reports to your provider) |
connexamine --help |
Help and options |
How to use ConnExamine on the Control Panel?
- Login to your account.
- Navigate to Global ConnExamine.
- Click on the
+ Claim Boxbutton. - Enter the
Code- which is theDeamon Tokenor theIP Address. - Click on
Claim.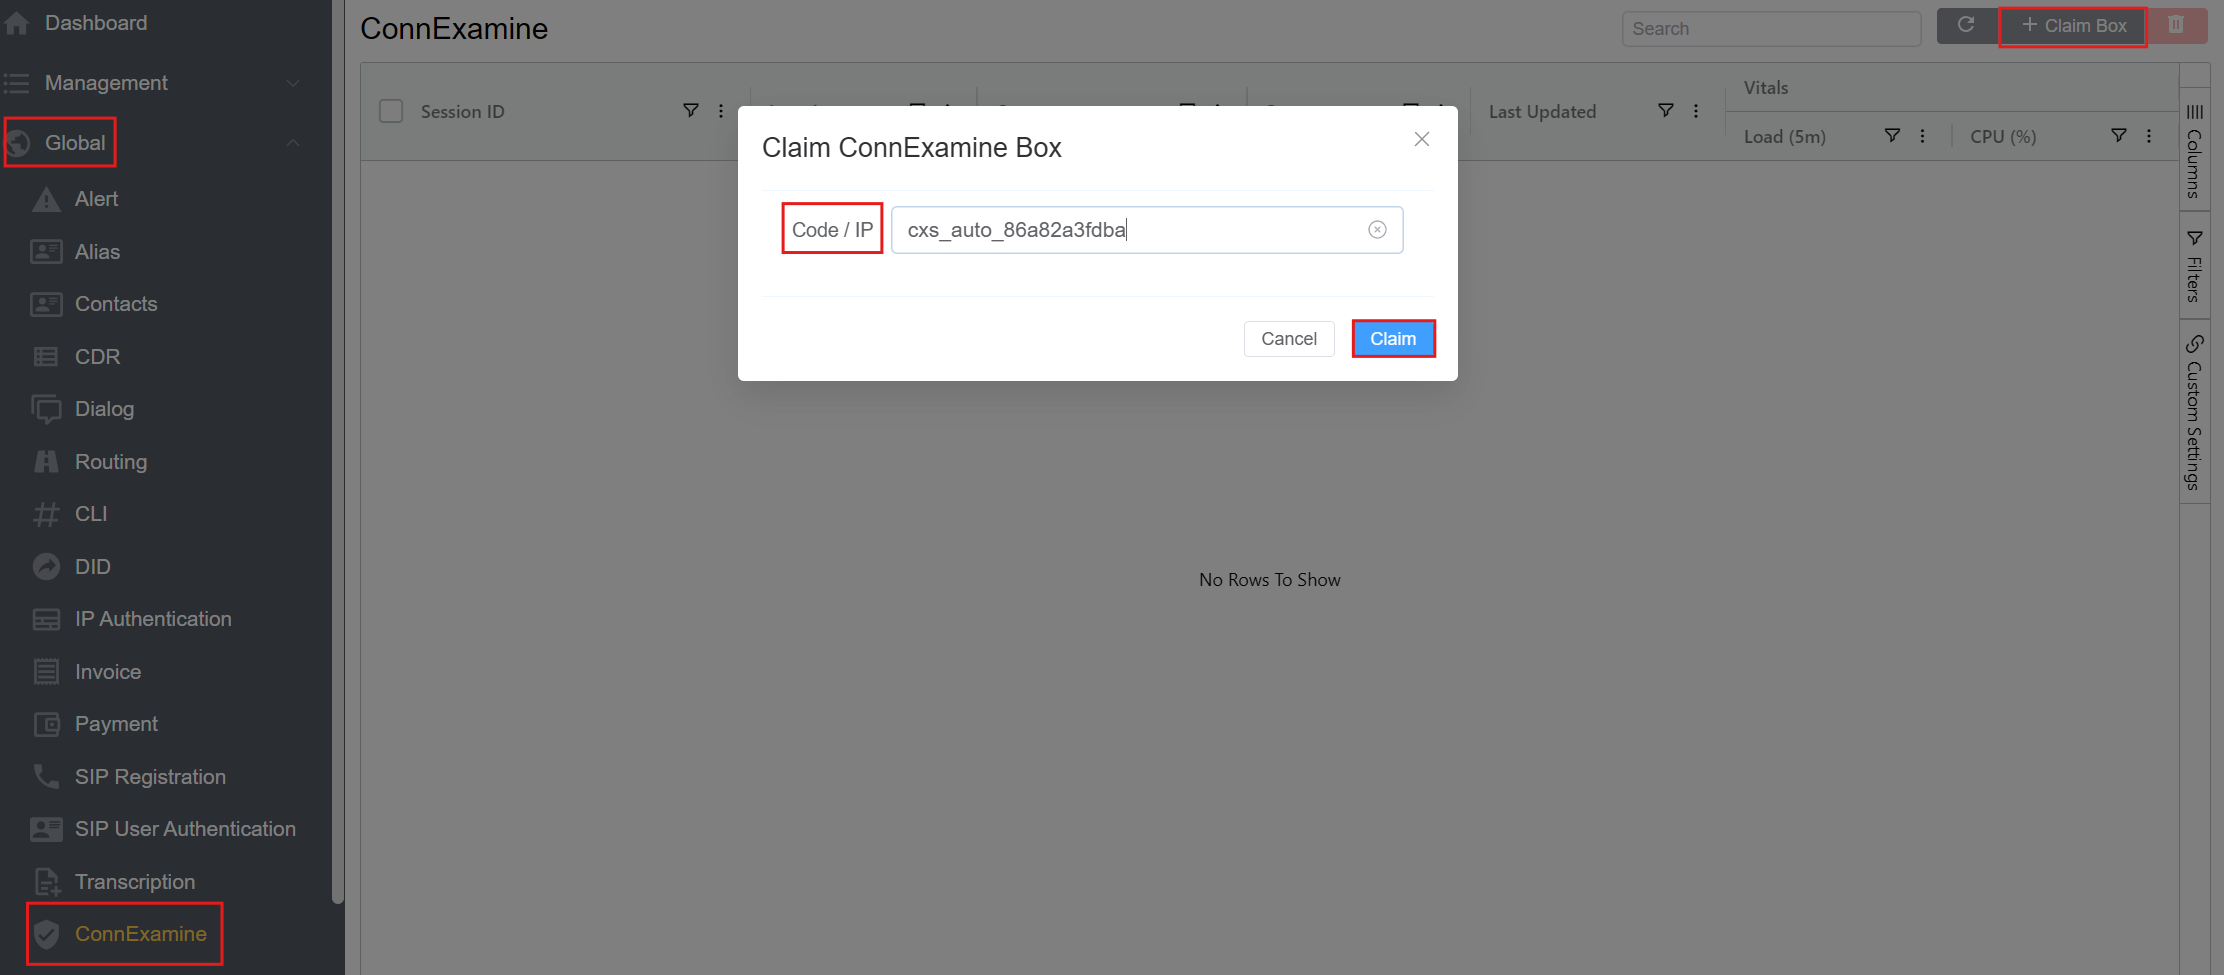 *
* - All the session information is visible on the ConnExamine dashboard.
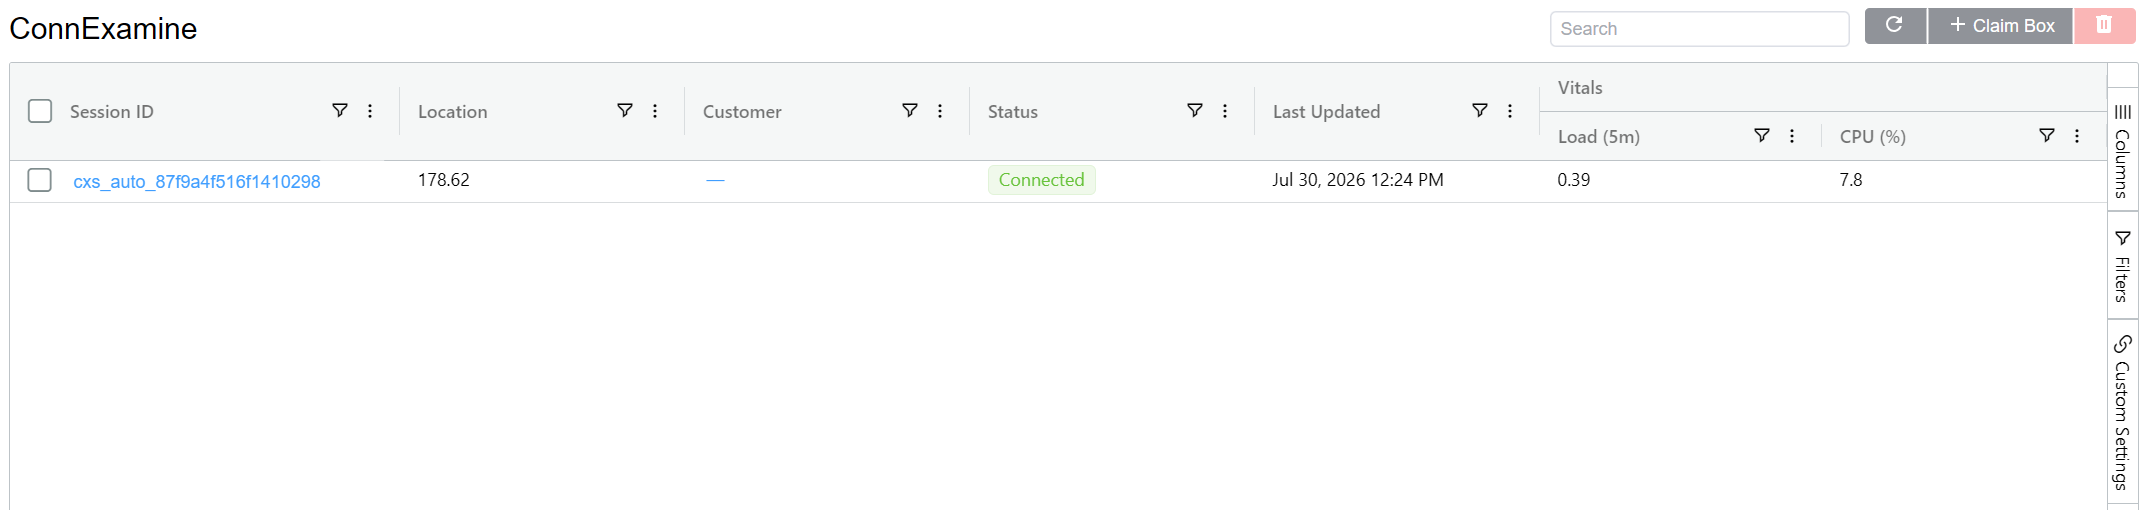
- Click on the
Session IDto get more insights on the current session.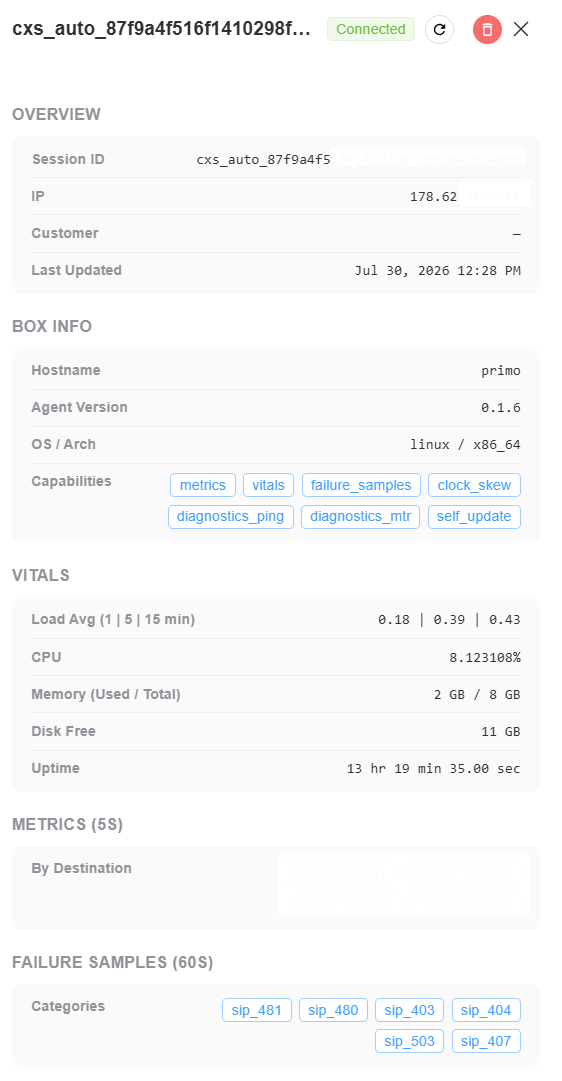
-
Session details explained:
-
Overview
Displays general information about the active Connexamine monitoring session.
| Field | Description |
|---|---|
| Session ID | Unique identifier assigned to the monitored Connexamine agent. This identifier is used to associate telemetry with the corresponding customer or support session |
| IP | Public IP address of the monitored host |
| Customer | Customer account associated with the monitored host. Displays - until the session has been linked to a customer |
| Last Updated | Date and time when the most recent telemetry was received from the agent |
- Box Info
Displays information about the monitored host and the installed Connexamine agent.
| Field | Description |
|---|---|
| Hostname | Hostname of the monitored system |
| Agent Version | Version of the installed Connexamine agent |
| OS / Arch | Operating system and CPU architecture of the monitored host |
| Capabilities | Lists the features supported by the connected agent. Each capability indicates functionality that is available for monitoring or remote diagnostics |
- Capability Definitions
| Capability | Description |
|---|---|
| metrics | Reports aggregated call setup metrics to the ConnexCS portal |
| vitals | Reports host health metrics, including CPU, memory, disk usage, uptime, and system load. |
| failure_samples | Collects representative failed call samples for troubleshooting |
| clock_skew | Detects and reports system clock drift or synchronization issues |
| diagnostics_ping | Allows remote ICMP ping diagnostics to a specified IP address |
| diagnostics_mtr | Allows remote MTR (My Traceroute) diagnostics for network path analysis |
| self_update | Supports automatic and remotely triggered agent updates |
- Vitals
Displays the current health and resource utilization of the monitored host.
| Field | Description |
|---|---|
| Load Avg (1 | 5 | 15 min) | Average system load over the previous 1, 5, and 15 minutes |
| CPU | Current CPU utilization of the monitored host |
| Memory (Used / Total) | Amount of memory currently in use compared to the total installed memory |
| Disk Free | Available disk space on the monitored host |
| Uptime | Time elapsed since the monitored system was last restarted |
- Metrics (5s)
Displays call setup statistics collected during the previous 5-second reporting interval.
| Field | Description |
|---|---|
| By Destination | Groups call setup metrics by destination IP address. Each destination includes aggregated statistics such as INVITE count, Trying responses, latency measurements, and other call setup metrics for that reporting interval |
- Failure Samples (60s)
Displays representative call failures collected during the previous 60-second sampling interval.
| Field | Description |
|---|---|
| Categories | Groups failures by SIP response code or timeout category (for example, sip_480, sip_481, sip_503). Selecting a category displays representative failed call samples to assist with troubleshooting recurring issues |
- Some Additional Fields
| Field | Description |
|---|---|
| Location | Geographic location of the monitored host, determined from its public IP address or associated metadata |
| Status | Current connection status of the Connexamine agent (for example, Connected or Disconnected) |
| Window (s) (Metrics) | Specifies the reporting interval, in seconds, over which call setup metrics are aggregated before being sent to the ConnexCS portal |
| Window (s) (Failure Samples) | Specifies the sampling interval, in seconds, during which failed call samples are collected and grouped before being reported |
How to use ConnExamine with ConnexCS Terminal
- Log in to your account.
- Click on the
CLI Terminalicon. - A command-line terminal appears, where you can execute supported ConnExamine commands and view the results.
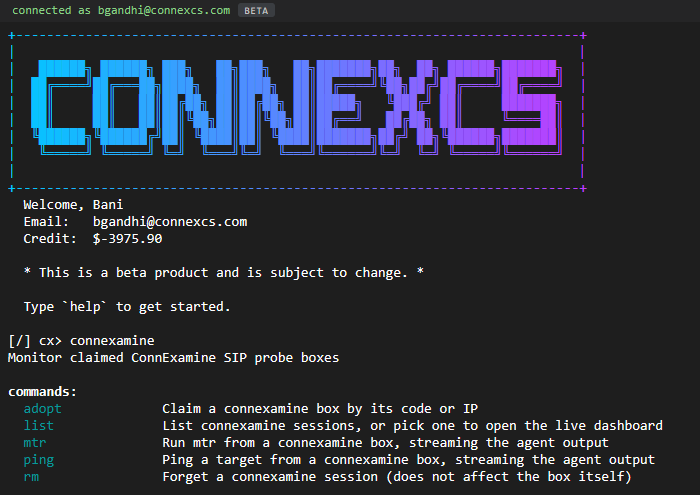
- Below are the supported commands:
| Command | Description | Example Use Case | Syntax | Example |
|---|---|---|---|---|
adopt |
Claims a Connexamine box using its unique code or IP address, allowing it to be managed from your account | Claim a newly deployed Connexamine box before running diagnostics | connexamine adopt <code\|ip> |
connexamine adopt A1B2C3 |
list |
Lists all adopted Connexamine sessions. You can also select a session to open its live monitoring dashboard | View all available Connexamine boxes and open the dashboard for a specific one | connexamine list [--json \| --plain] then select the connexamine box |
connexamine list |
mtr |
Runs an MTR (My Traceroute) test from a selected Connexamine box and streams the results in real time | Diagnose packet loss or routing issues between the Connexamine box and a remote destination | connexamine mtr <session-id> <target> |
connexamine mtr sess-001 example.com |
ping |
Sends ICMP echo requests from a selected Connexamine box and streams the live output | Verify network connectivity and latency to a remote host | connexamine ping <session-id> <target> |
connexamine ping sess-001 example.com |
rm |
Removes (forgets) a saved Connexamine session from your local client. This does not remove or reset the actual Connexamine box | Clean up old or unused Connexamine sessions from your CLI | connexamine rm <session-id> [-f \| --force] |
connexamine rm sess-001 --force |
show |
Displays the complete telemetry snapshot for a specific Connexamine session, including collected diagnostic information | Review detailed telemetry and health information for a Connexamine box | connexamine show <session-id> [--json] |
connexamine show sess-001 |
Understanding Security in ConnExamine
This section details the operational behavior of ConnExamine, including the network traffic it inspects, the data it collects, and the security measures implemented to support safe deployment in production environments, particularly when running in Daemon (--auto) mode.
Key Analysis Areas
ConnExamine only inspects SIP signaling traffic on UDP port 5060. It does not capture or process:
- Media (RTP/audio) at all
- SIP over TCP, TLS (SIPS), or non-standard ports
- Any non-SIP traffic on the interface it's watching
Within that SIP traffic, it only actively tracks outbound INVITEs — calls your host originates. Inbound INVITEs and other SIP methods (BYE, REGISTER, etc.) may be seen in passing but are not tracked or reported as calls.
Data Collection & Purpose
| Data | Collected? | Why |
|---|---|---|
| Call timing (Trying/PDD/Ring, per call) | Yes | This is the entire point of the tool — measuring call-setup health |
| SIP response codes / timeout reasons | Yes | Distinguishes a real carrier rejection (e.g. 486 Busy) from a silent timeout, which point to very different root causes |
| Call-ID | Yes | The only way to let a human correlate a reported metric back to a specific, real call for investigation |
| Destination/source IP | Yes | Identifies which upstream connection a problem belongs to — essential when a box has more than one trunk |
| Host vitals (CPU, memory, disk, load, uptime) | Yes, in --auto mode only |
Distinguishes "the connection is unhealthy" from "the box itself is overloaded," which otherwise look identical from the outside |
| Caller / called phone numbers (FROM/TO) | Shown locally only — never transmitted | Interactive mode displays them on-screen for the person actively debugging, because they're often necessary context in the moment. Daemon mode's telemetry to ConnexCS deliberately omits them — they aren't needed to measure call-setup timing, and there's no reason for that data to leave the box |
| Call content / audio | Never | Connexamine never touches media, only signaling headers |
| SIP message bodies (SDP, etc.) | Never | Only specific signaling headers (Call-ID, From, To, response codes) are parsed |
In short: what leaves the box in --auto mode is timing statistics, response codes, Call-IDs, IPs, and host health — the minimum needed to diagnose a connectivity problem remotely. It is not a call log and cannot be used to reconstruct who called whom.
Summary
Connexamine is built to be safe to run unattended, with production SIP traffic, on a customer's edge:
- It only looks at SIP signaling, never media or call content.
- What it sends off the box is deliberately minimal — enough to diagnose connectivity problems, nothing that amounts to a call log.
- Everything sent over the network is encrypted in transit.
- The one remote-control surface (diagnostics) is narrowly scoped and validated before anything is ever executed.