Carrier Win Rate
Document Metadata
Category: Reporting & Analytics / Carrier Win Rate
Audience: Administrators, Operations Teams, Routing Teams, Billing Teams, Engineers
Difficulty: Intermediate
Time Required: Approximately 15–30 minutes
Prerequisites: Active ConnexCS account with Reports access; familiarity with providers, carrier routing, call volume, and basic reporting concepts.
Related Topics: Reports, Breakout Report, Routing Strategy, Carrier Management
Next Steps: Navigate to Reports > Carrier Win Rate, select the required date range, review carrier positions and provider results, and use the Columns and Filters panels to refine the displayed data.
Report Carrier Win Rate
Overview
The Carrier Win Rate report provides a view of provider performance based on carrier positions during the selected reporting period.
The report presents providers according to their position, allowing you to review how frequently each provider appears in the available positions.
The report provides both a visual summary and a detailed provider table.
The main components of the report are:
- 1st Place
- 2nd Place
- 3rd Place
- Provider Results Table
The report can be used to review carrier performance and compare provider positions over a selected period.
Use Cases
The Carrier Win Rate report can be used to:
- Review provider position results over a selected period.
- Compare providers across first, second, and third positions.
- Review the number of occurrences associated with each provider position.
- Identify providers appearing frequently in a particular position.
- Analyze changes in provider position distribution over time.
- Support carrier performance and routing analysis.
- Review provider results using a specific date and time range.
- Filter provider position results for more focused analysis.
Using the Carrier Win Rate Report
-
Navigate to Reports Carrier Win Rate.
-
Select the required date and time range.
-
Click Refresh to generate the report using the selected date range.
-
Review the 1st Place, 2nd Place, and 3rd Place sections.
-
Review the provider results in the table below the charts.
-
Use the Columns and Filters panels to customize and refine the displayed results.
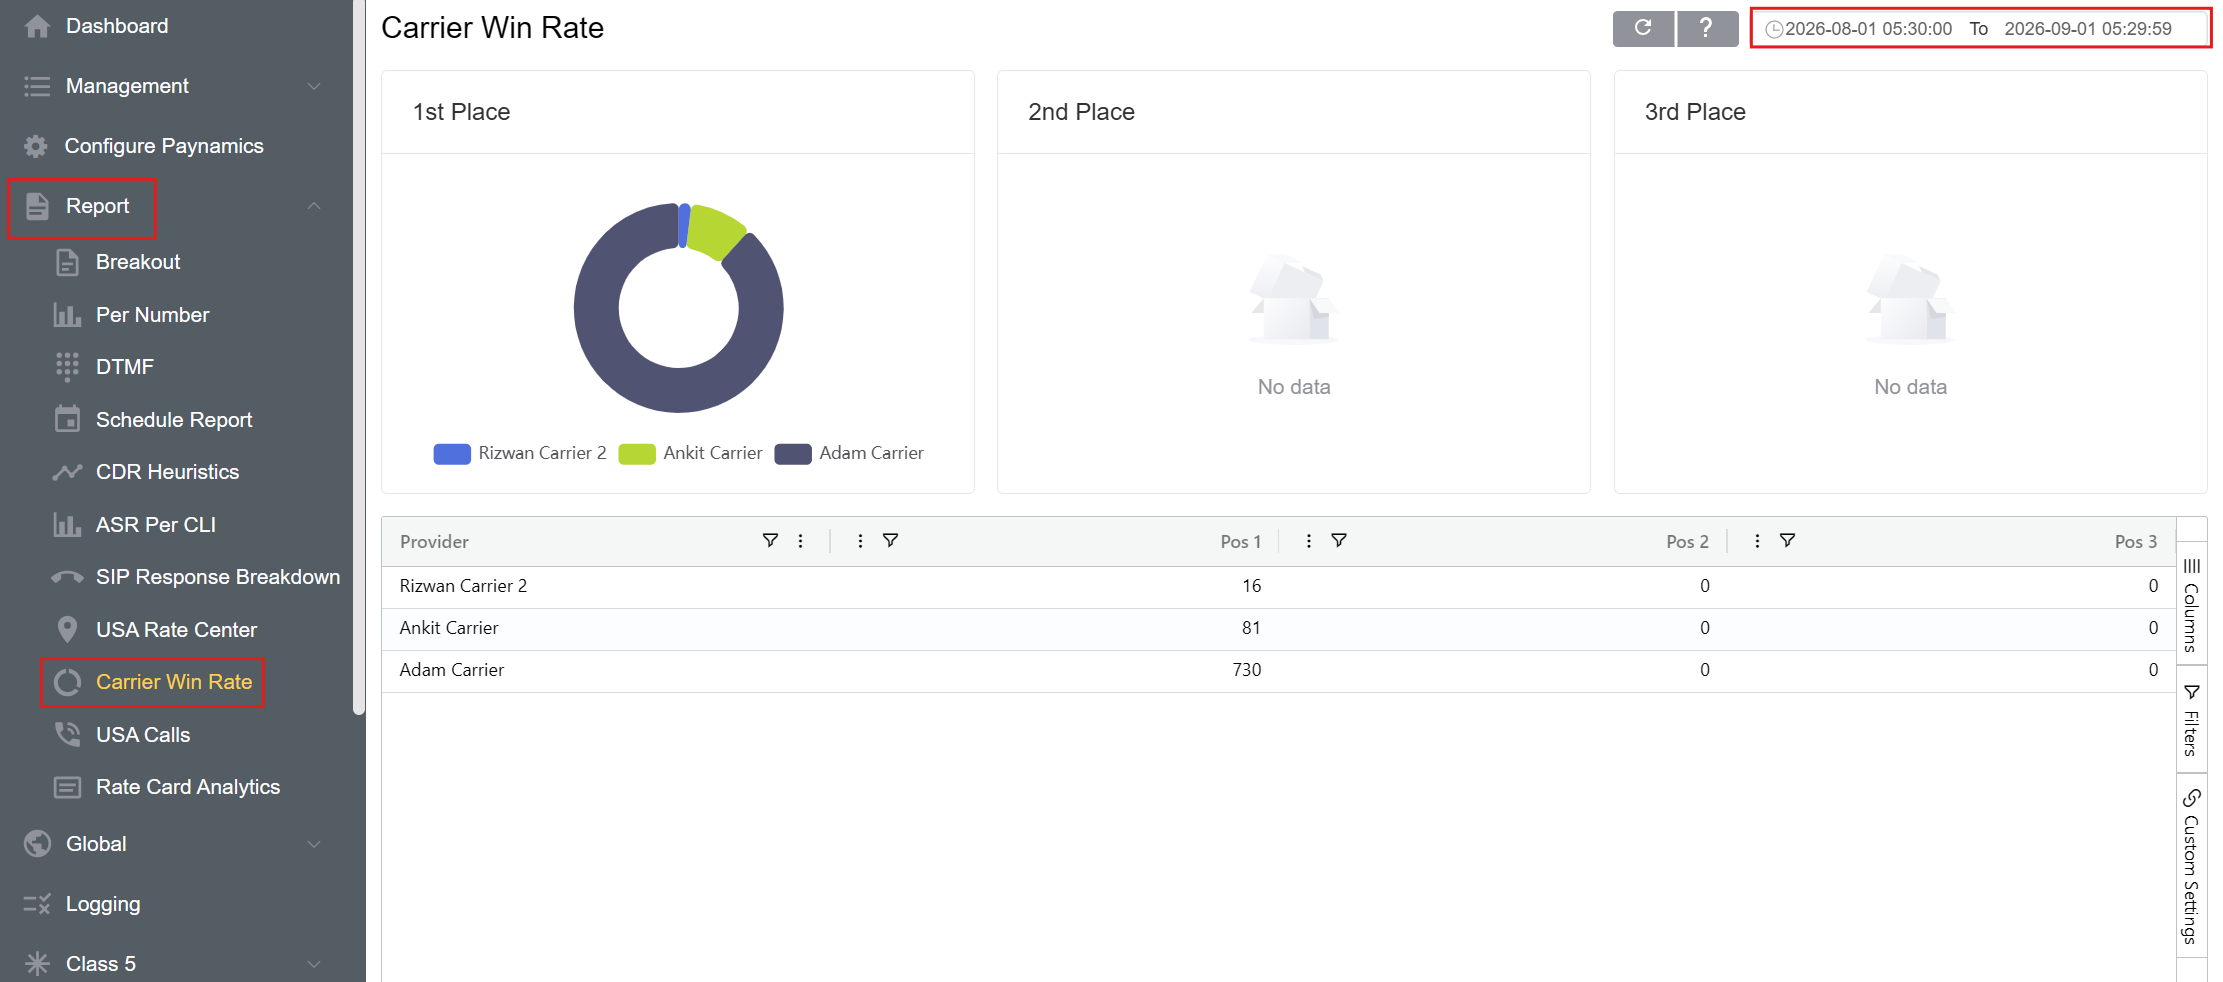
Report Overview
Position Summary
The report displays three position panels:
| Position | Description |
|---|---|
| 1st Place | Displays the provider distribution associated with the first position. |
| 2nd Place | Displays the provider distribution associated with the second position. |
| 3rd Place | Displays the provider distribution associated with the third position. |
Each position panel provides a visual representation of the providers associated with that position.
A position panel may display No data when there is no data available for that position during the selected reporting period.
Provider Chart
The position chart provides a visual representation of the providers associated with the selected position.
The chart legend identifies the providers included in the displayed result.
The visual distribution allows you to compare the relative number of occurrences represented by the providers for the selected position.
Provider Results
The provider results table provides a detailed view of carrier positions.
The table includes the following fields:
| Column | Description |
|---|---|
| Provider | Provider associated with the carrier position results. |
| Pos 1 | Number of times the provider is associated with the first position. |
| Pos 2 | Number of times the provider is associated with the second position. |
| Pos 3 | Number of times the provider is associated with the third position. |
Example
For example, the report may display:
| Provider | Pos 1 | Pos 2 | Pos 3 |
|---|---|---|---|
| Rizwan Carrier 2 | 16 | 0 | 0 |
| Ankit Carrier | 81 | 0 | 0 |
| Adam Carrier | 730 | 0 | 0 |
The values represent the number of occurrences associated with each provider and position for the selected reporting period.
Understanding Carrier Positions
The Pos 1, Pos 2, and Pos 3 fields allow provider position results to be reviewed separately.
For example:
- A provider with a higher Pos 1 value appears more frequently in the first position during the selected period.
- A provider with values in Pos 2 or Pos 3 appears in those respective positions.
- A provider may have results across more than one position.
- A position can contain no results when there is no corresponding data for the selected period.
The report should be reviewed together with the selected date range and the underlying routing or call activity represented by the report.
Filters
The Filters panel allows you to refine the data displayed in the Carrier Win Rate report.
Filters can be applied to available report fields, including:
- Provider
- Pos 1
- Pos 2
- Pos 3
Select a field in the Filters panel and choose the required filter condition.
Columns
The Columns panel allows you to manage the fields displayed in the provider results table.
Use the panel to show or hide available columns according to the information required for the analysis.
The available provider result fields include:
- Provider
- Pos 1
- Pos 2
- Pos 3
Column configuration affects the presentation of the results and does not change the underlying report data.
Custom Settings
The Custom Settings panel provides options for adjusting the appearance and presentation of the Carrier Win Rate report.
-
Theme: The Theme setting allows you to select the visual theme used for the report interface.
-
Row Height: The Row Height setting controls the vertical spacing of rows in the provider results table.
-
Lower row height: Displays more provider rows at once.
-
Higher row height: Provides more spacing between rows for easier readability.
-
Custom settings affect the presentation of the report and do not change the underlying report data.
Refreshing the Report
Click Refresh after changing the date range or other report parameters to ensure the report reflects the current selections.
Refreshing the Carrier Win Rate Report
Remember to click Refresh each time parameters change to ensure you see the most recent selections onscreen. When refreshing the report, use the Report Refresh button rather than the browser refresh button.