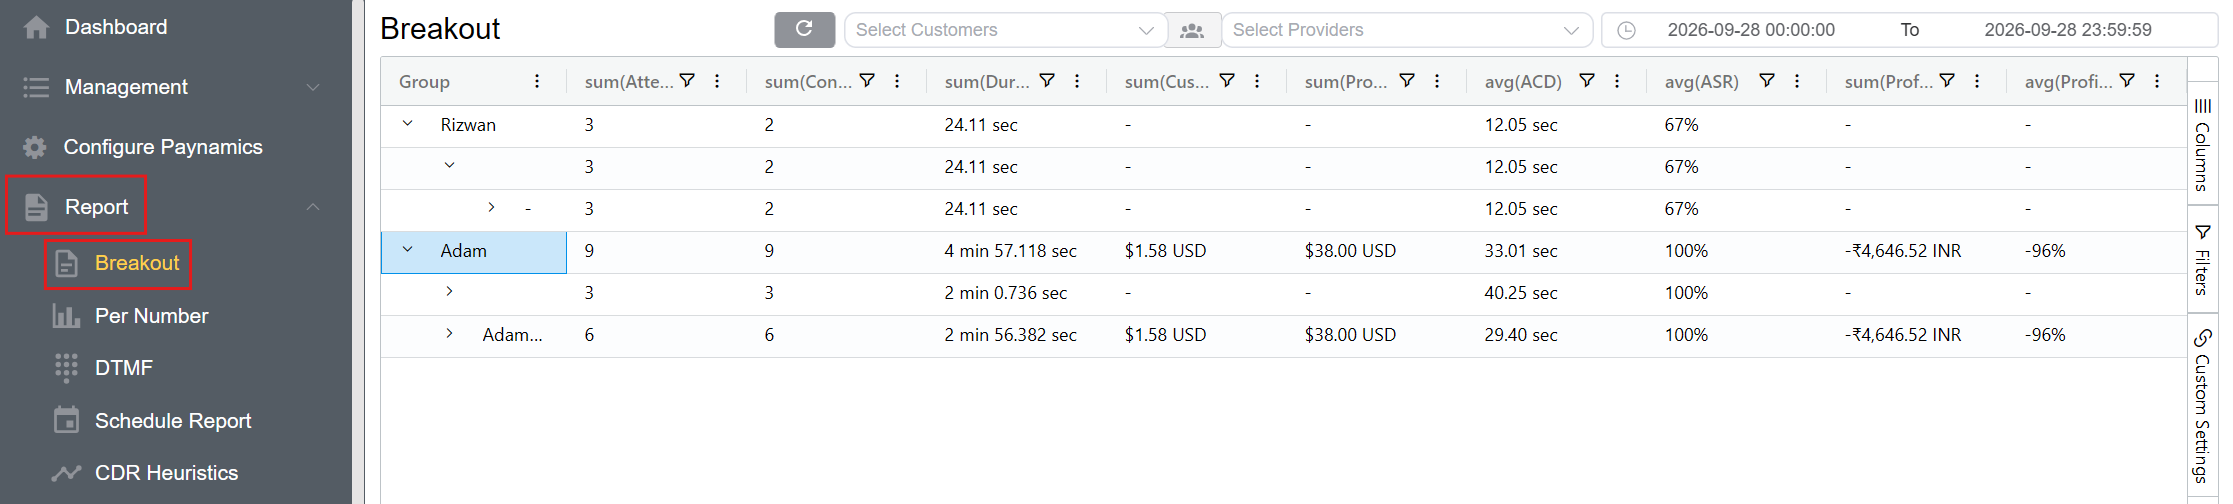
Breakout Report
Document Metadata
Category: Reporting & Analytics / Breakout Report
Audience: Administrators, Billing Teams, Operations Teams, Engineers
Difficulty: Intermediate
Time Required: Approximately 15–30 minutes
Prerequisites: Active ConnexCS account with Reports access; familiarity with customer and provider data, call metrics, and basic CDR concepts.
Related Topics: Reports
Next Steps: Navigate to the Breakout report, select the required customers, providers, and date range, apply filters, refresh the report, and use Columns or Pivot Mode to customize the report view and analyze the data.
Report Breakout
Overview
The Breakout report provides a consolidated view of customer call activity and associated billing and performance metrics.
It uses processed Call Detail Record (CDR) data to present information such as call attempts, connected calls, duration, customer cost, provider cost, Average Call Duration (ACD), Answer-Seizure Ratio (ASR), profit, and profit margin.
The report can be filtered by customers, providers, and date range. Data can also be grouped and customized to provide different levels of detail for analysis.
Billing Accuracy: The Breakout report is based on processed CDR data and is considered billing accurate. Customer billing is calculated using this processed CDR data.
Report Interface
The Breakout report provides the following controls:
| Control | Description |
|---|---|
| Refresh | Refreshes the report using the currently selected parameters and filters. |
| Customers | Filters the report to one or more customers. |
| Providers | Filters the report to one or more providers. |
| Date Range | Specifies the start and end date/time for the report data. |
| Column Filters | Filters individual columns directly within the report grid. |
| Columns | Controls which columns are displayed in the report. |
| Filters | Provides additional filtering options for the displayed data. |
| Pivot Mode | Enables grouping and aggregation of report data by selected fields. |
Filters
The Filters panel allows you to refine the data displayed in the Breakout report by applying conditions to individual fields. Filters can be applied to fields such as Provider, Customer Destination Name, Provider Destination Name, Attempts, and other available report columns.
Select a field in the Filters panel and choose the required filter condition. The available conditions depend on the type of data in the selected field.
Filter Conditions
| Condition | Description |
|---|---|
| Equals | Displays only records where the field exactly matches the specified value. |
| Does not equal | Excludes records where the field matches the specified value. |
| Less than | Displays records where the value is lower than the specified value. |
| Less than or equal to | Displays records where the value is less than or equal to the specified value. |
| Greater than | Displays records where the value is higher than the specified value. |
| Greater than or equal to | Displays records where the value is greater than or equal to the specified value. |
| Between | Displays records where the value falls within the specified range. |
Example
For the Attempts field:
- Equals
10— shows records with exactly 10 attempts. - Greater than
10— shows records with more than 10 attempts. - Less than or equal to
10— shows records with less than 10 attempts.
Custom Settings
The Custom Settings panel provides options for adjusting the appearance and presentation of the Breakout report.
-
Theme: The Theme setting allows you to select the visual theme used for the report interface. Select a theme from the available options to change the appearance of the report grid.
-
Row Height: The Row Height setting controls the vertical spacing of rows in the report grid. Use the slider to increase or decrease the amount of information displayed vertically on the screen.
- Lower row height: Displays more rows at once.
- Higher row height: Provides more spacing between rows for easier readability.
Custom settings affect the presentation of the report and do not change the underlying report data.
Report Metrics
| Metric / Field | Description |
|---|---|
| Call Time | The date and time associated with the call |
| Customer | The customer associated with the call |
| Provider | The provider or carrier associated with the call |
| Customer Destination Name | The name of the destination associated with the customer-side call |
| Provider Destination Name | The destination name associated with the provider-side call |
| Attempts | The total number of call attempts made for the selected data |
| Connected | The number of call attempts that resulted in a connected call |
| Customer Duration | The call duration recorded on the customer side |
| Provider Duration | The call duration recorded on the provider side |
| Duration | The overall call duration used for the report calculation |
| Customer Charge | The amount charged to the customer for the call |
| Provider Charge | The amount charged by the provider for the call |
| ACD | Average Call Duration. Represents the average duration of connected calls |
| ASR | Answer-Seizure Ratio. Represents the percentage of call attempts that were successfully answered or connected |
| DTMF | Indicates DTMF activity associated with the call. Dual-Tone Multi-Frequency (DTMF) is commonly used for keypad inputs during calls |
| DTMF Percent | The percentage associated with DTMF activity in the selected call data |
| Profit | The calculated difference between the applicable customer charge and provider charge |
| Profit Percent | The calculated profit expressed as a percentage |
| SDP | Session Description Protocol (SDP) information associated with the call session, used to describe session and media parameters |
Filtering the Report
Use the controls at the top of the report to narrow the data set:
- Select one or more Customers.
- Select one or more Providers.
- Specify the required date and time range.
- Apply any additional column-level filters.
- Click Refresh to load the updated results.
Individual columns can also be filtered directly from the report grid using the filter control in the column header.
Grouping and Pivot Mode
Pivot Mode allows the report data to be reorganized into hierarchical groups. This is useful when the same data needs to be analyzed from different dimensions.
To configure a pivot:
- Enable Pivot Mode from the Columns panel.
- Select the fields to use as Row Groups.
- Select the metrics to display as Values.
- Expand or collapse groups in the report grid to navigate between levels.
For example, grouping by Provider and Provider Destination can be used to view which provider routes are being used for calls and examine the associated call metrics at each level.
The report automatically aggregates the selected metrics for each group.
Refreshing the Report
The report should be refreshed whenever the reporting parameters or filters are changed.
Important: Use the Report Refresh button rather than the browser's refresh button. The Report Refresh action applies the current customer, provider, date, and filtering selections when retrieving the report data.
Example
Suppose the report is grouped by customer and then by provider. Expanding a customer displays the corresponding provider-level data, including call attempts, connected calls, duration, ACD, ASR, and applicable cost and profit metrics.
This hierarchical view allows users to move from a high-level customer summary to more detailed routing and provider-level information without leaving the Breakout report.