Rate Card Analytics
Document Metadata
Category: Reporting & Analytics / Rate Card Analytics
Audience: Administrators, Billing Teams, Operations Teams, Routing Teams, Product Teams
Difficulty: Intermediate
Time Required: Approximately 15–30 minutes
Prerequisites: Active ConnexCS account with Reports access; configured rate cards and familiarity with customer usage, traffic, and billing concepts.
Related Topics: Reports, Rate Cards, Breakout Report
Next Steps: Navigate to Report > Rate Card Analytics, select a rate card, define the reporting period, and review customer usage, traffic trends, and billing information.
`
Report Rate Card Analytics
Overview
The Rate Card Analytics report provides analytics for a selected rate card. It helps users review how a rate card is being used across customers, understand traffic patterns over time, and examine associated billing information.
The Rate Card Analytics dashboard provides three main analytics views:
- Customer Breakdown — Displays call counts per customer on the selected rate card.
- Usage Trends — Shows traffic patterns over time across customers.
- Billing Summary — Provides total revenue and per-customer spend information.
Analytics
Once a rate card is selected, the dashboard provides the following analytics views.
Customer Breakdown
Customer Breakdown provides call counts per customer on the selected rate card.
This view can be used to understand how call activity is distributed among customers using the selected rate card.
Key information:
- Customers associated with the selected rate card.
- Call counts for each customer.
- Relative customer usage based on call volume.
Usage Trends
Usage Trends provides an overview of traffic patterns over time across all customers.
This view can be used to analyze how traffic changes during the selected reporting period.
It helps users review:
- Traffic activity over time.
- Changes in usage during the selected period.
- Overall traffic patterns across customers using the rate card.
Billing Summary
Billing Summary provides information about total revenue and per-customer spend associated with the selected rate card.
This view can be used to review:
- Total revenue generated through the rate card.
- Spend associated with individual customers.
- Customer-level billing patterns.
Analytics Overview
| Analytics | Description |
|---|---|
| Customer Breakdown | Call counts per customer on the selected rate card. |
| Usage Trends | Traffic patterns over time across all customers. |
| Billing Summary | Total revenue and per-customer spend. |
Before viewing the analytics, a rate card must be selected from the rate card selector.
Use Cases
Rate Card Analytics can be used to:
- Review call volume by customer for a specific rate card.
- Analyze traffic patterns over time.
- Understand customer usage of a rate card.
- Review total revenue associated with a rate card.
- Examine per-customer spend.
- Support rate card and billing analysis.
- Identify changes in traffic or customer usage during a selected period.
- Combine customer, traffic, and billing information when reviewing rate card performance.
Using the Rate Card Analytics
To view analytics for a rate card:
- Navigate to Report Rate Card Analytics.
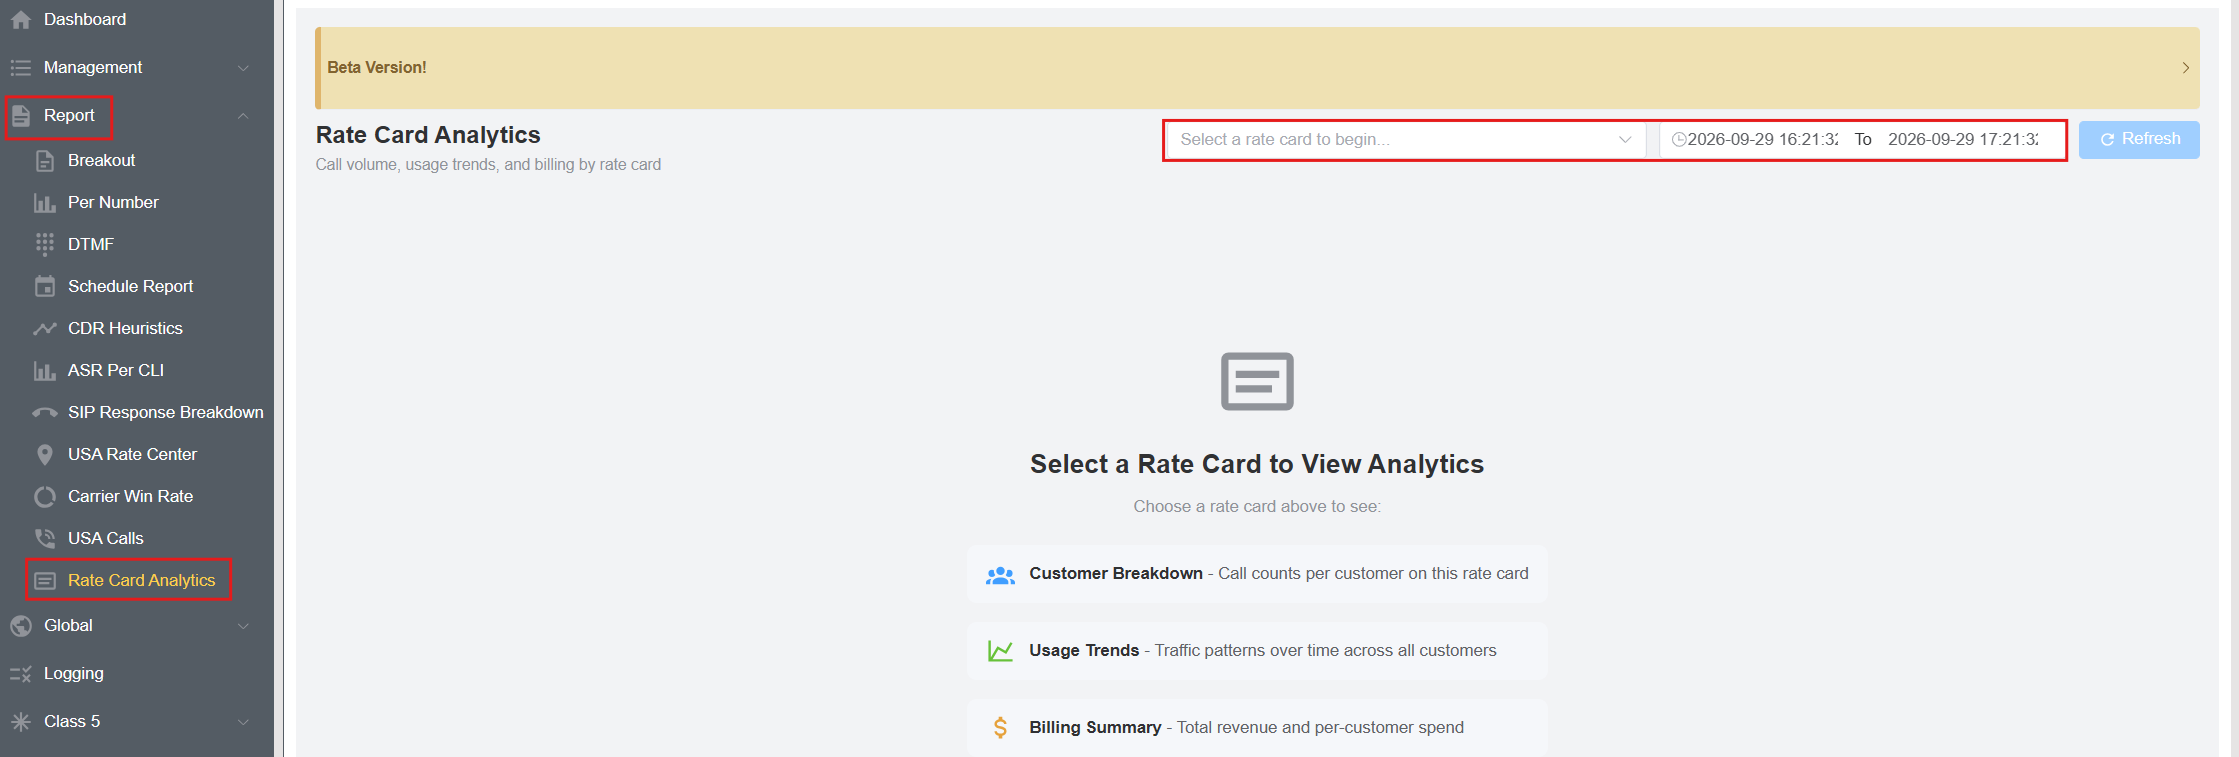
- Use the Select a rate card to begin... selector at the top of the page.
- Select the Customer Rate Card or Provider Rate Card you want to analyze.
- Use the date selector to define the reporting period.
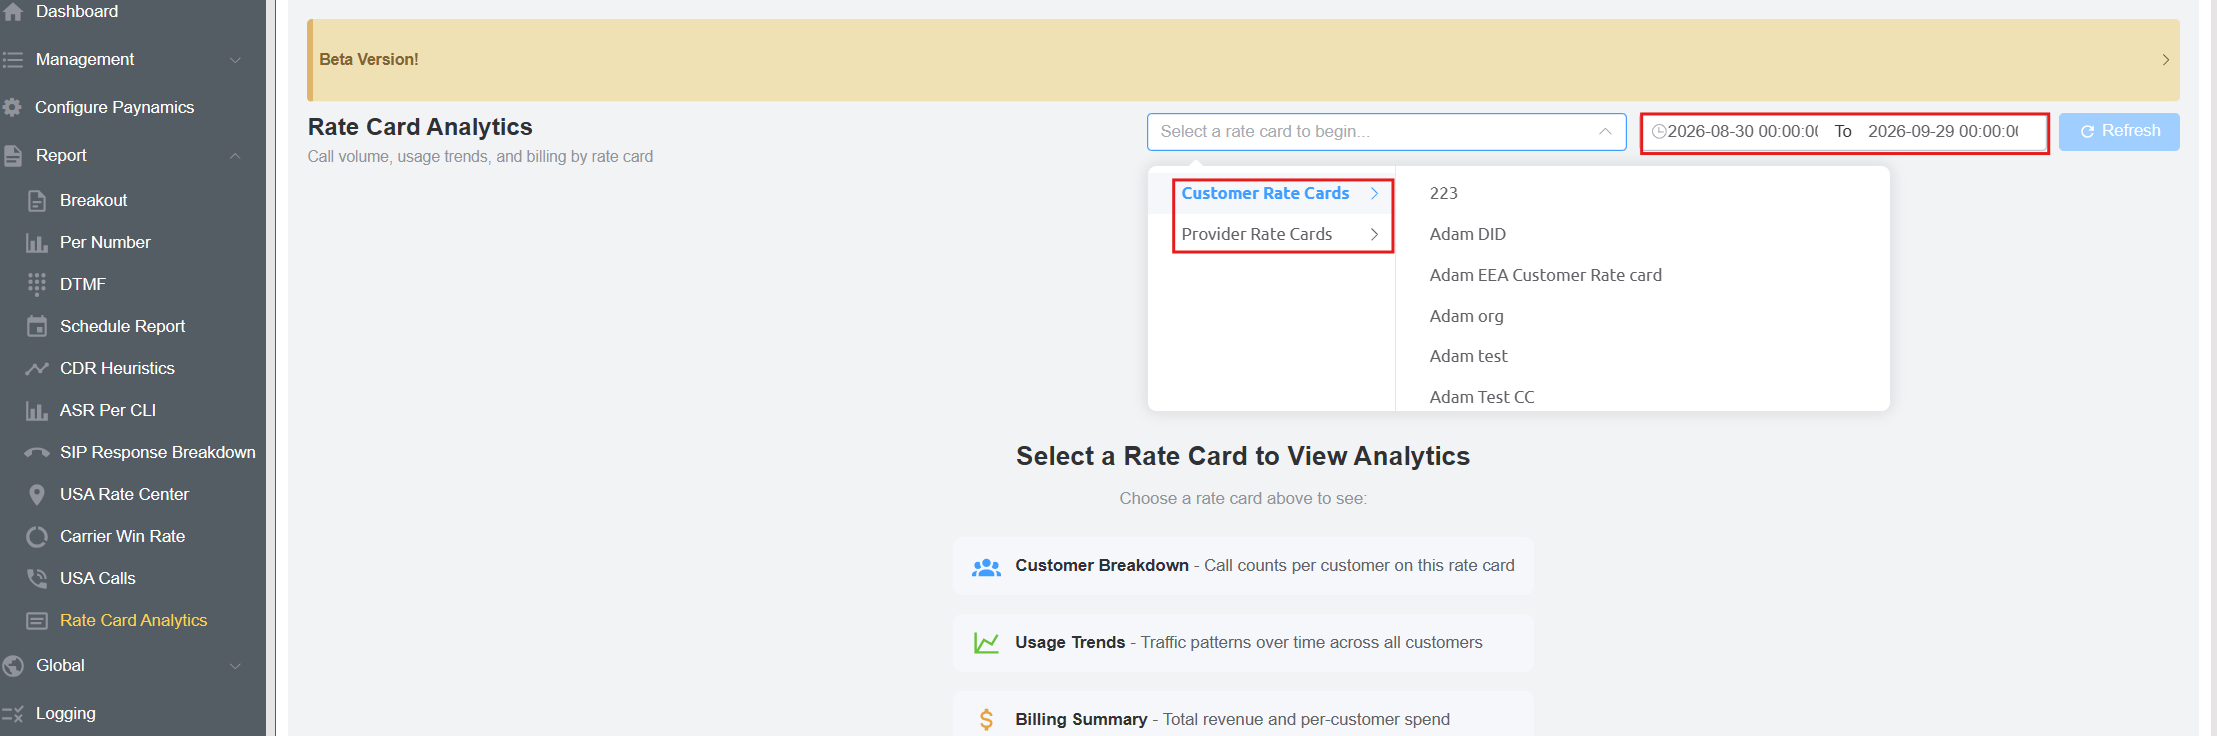
- Review the available analytics for the selected rate card. You have 4 options Overview, Customer Breakdown, Usage Trend and Billing. These are discussed below in a separate section: Avaialable Analytics.
- Use Refresh to reload the analytics after changing the rate card or date range.
The analytics are displayed after a rate card is selected. When no rate card is selected, the dashboard displays Select a Rate Card to View Analytics.
Available Analytics
The Overview section provides a high-level summary of activity and performance for the selected rate card and reporting period.
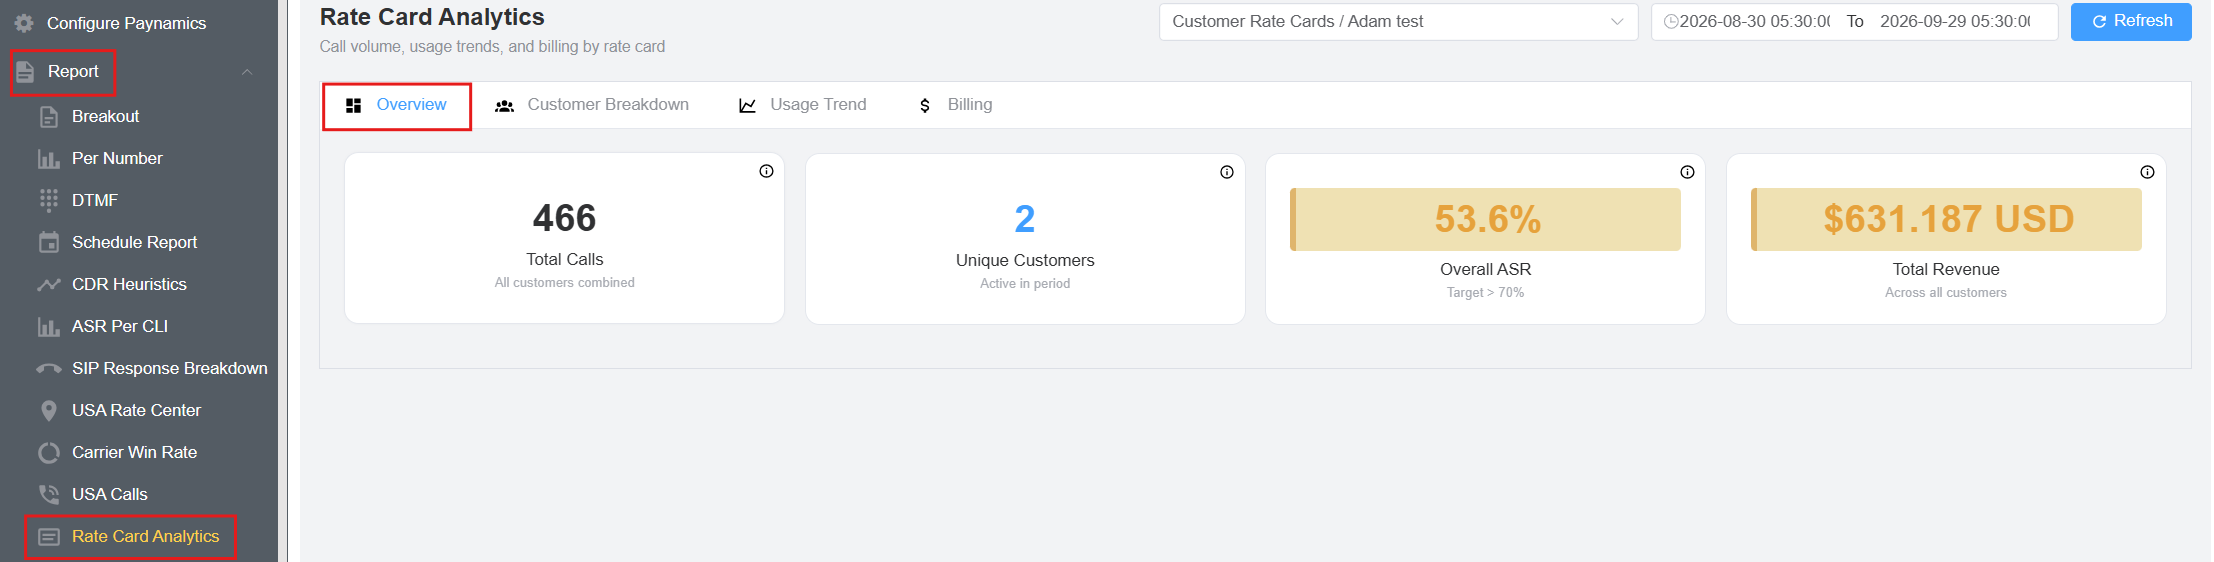
It displays four key metrics:
| Metric | Description |
|---|---|
| Total Calls | Total number of calls across all customers during the selected period. |
| Unique Customers | Number of unique customers active during the selected period. |
| Overall ASR | Overall Answer-Seizure Ratio (ASR) across the reported traffic. The dashboard also displays a target reference of >70%. |
| Total Revenue | Total revenue generated across all customers during the selected period. |
These metrics provide a quick snapshot of call volume, customer activity, call answer performance, and revenue before reviewing the detailed Customer Breakdown, Usage Trend, and Billing sections.
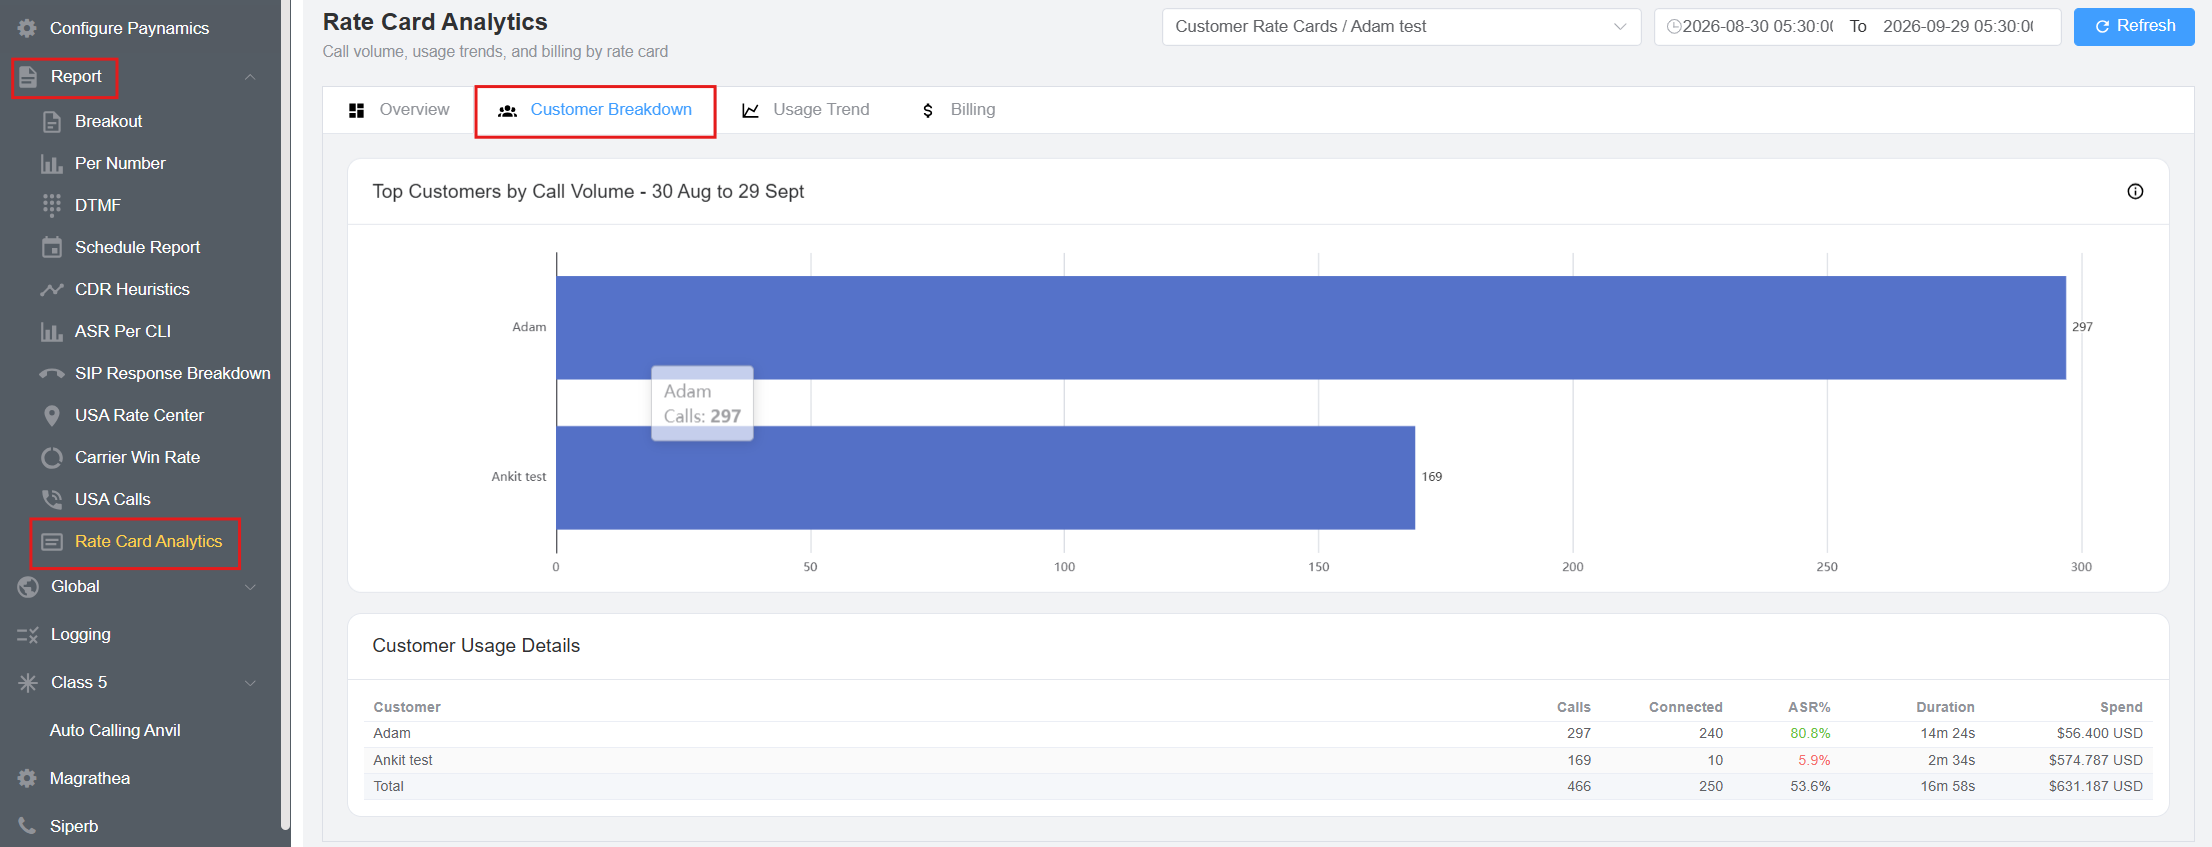
The Customer Breakdown section provides a customer-level view of call activity for the selected rate card and reporting period.
-
Top Customers by Call Volume
The Top Customers by Call Volume chart displays the number of calls associated with each customer.
The horizontal bar chart allows you to compare customer call volumes at a glance. In the example:
- Adam — 297 calls
- Ankit test — 169 calls
- Total — 466 calls
-
Customer Usage Details
The Customer Usage Details table provides more detailed usage and billing information for each customer.
Column Description Customer Name of the customer associated with the rate card traffic. Calls Total number of calls for the customer during the selected period. Connected Number of calls that were successfully connected. ASR % Answer-Seizure Ratio for the customer's traffic. Duration Total call duration for the customer. Spend Amount spent by the customer for the reported traffic. The table also includes a Total row that summarizes the combined results across all customers.
This section helps you understand which customers generate the most call traffic and how their connected calls, ASR, duration, and spend compare within the selected rate card.
The Usage Trend section provides a time-based view of call activity and call performance for the selected rate card and reporting period.
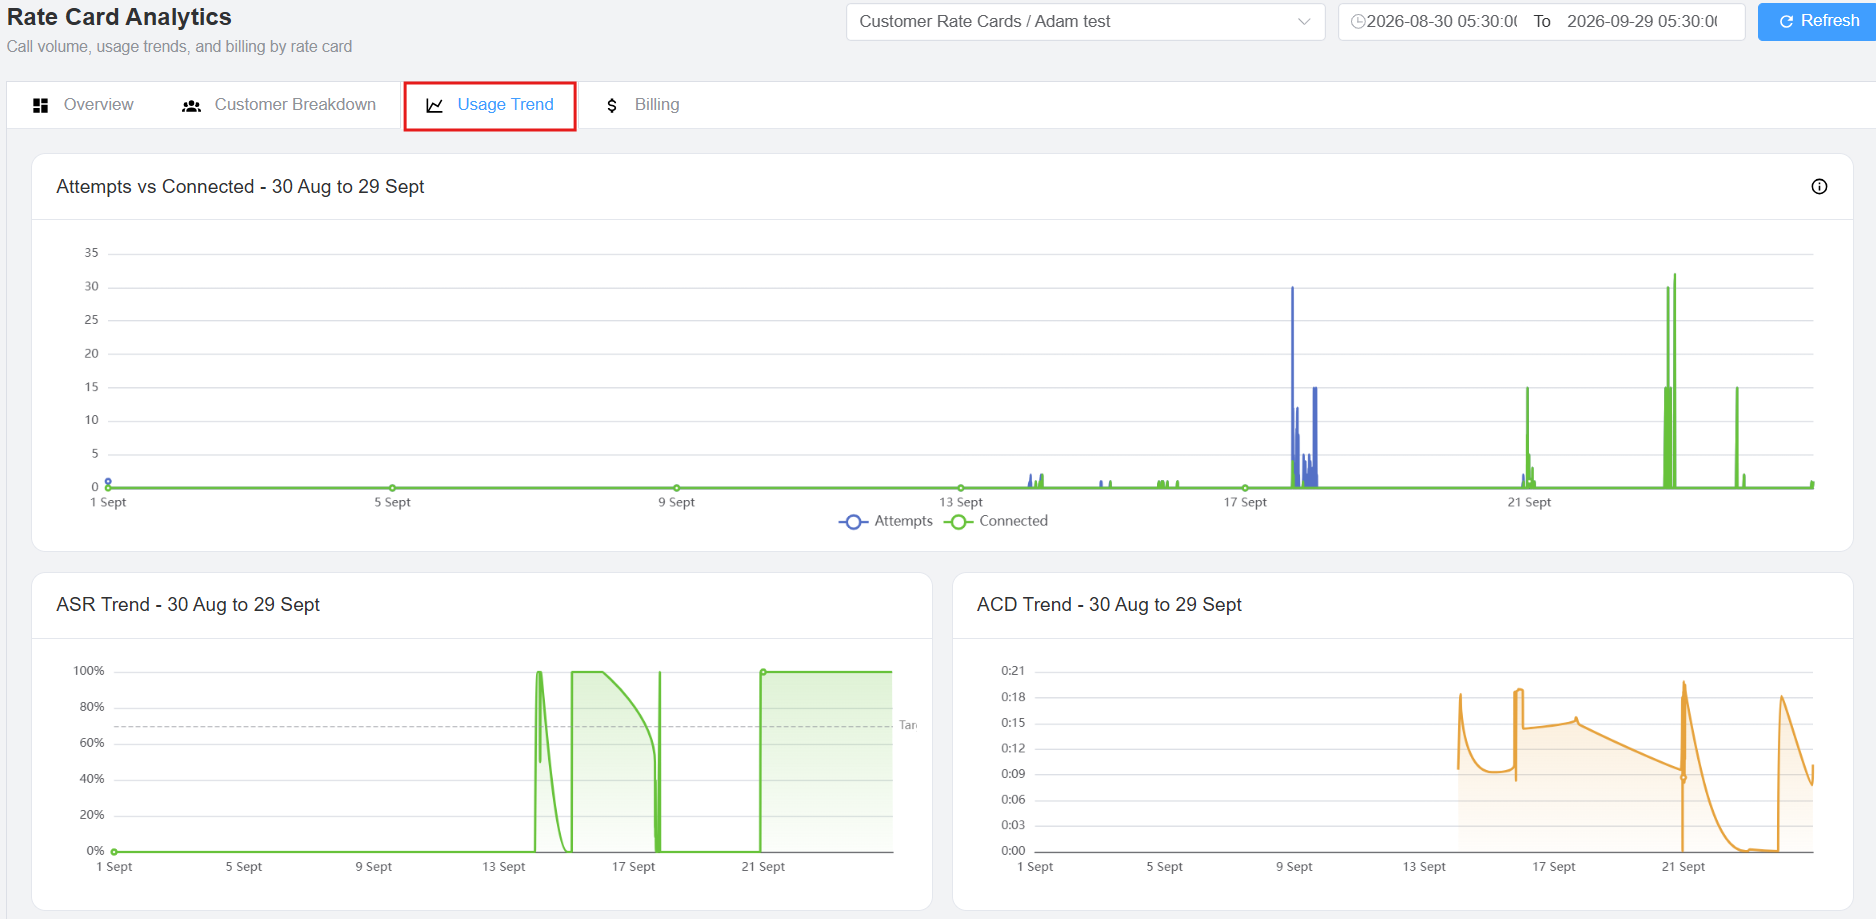
It includes three charts:
-
Attempts vs Connected
The Attempts vs Connected chart compares the number of call attempts with the number of successfully connected calls over time.
- Attempts — Total call attempts recorded during each point in the reporting period.
- Connected — Number of calls that successfully connected during each point in the reporting period.
This chart helps identify changes in call volume and the relationship between attempted and connected calls over time.
-
ASR Trend
The ASR Trend chart shows the Answer-Seizure Ratio (ASR) over the selected period.
ASR represents the percentage of call attempts that were successfully answered. The chart allows you to observe changes in answer performance over time.
The dashboard also displays a target reference line for ASR.
-
ACD Trend
The ACD Trend chart displays the Average Call Duration (ACD) over the selected period.
It shows how the average duration of connected calls changes over time, helping you review variations in call duration and overall call engagement.
Together, these charts provide a time-based view of call volume, connection performance, answer rates, and call duration for the selected rate card.
The Billing section provides a financial view of the selected rate card and reporting period.
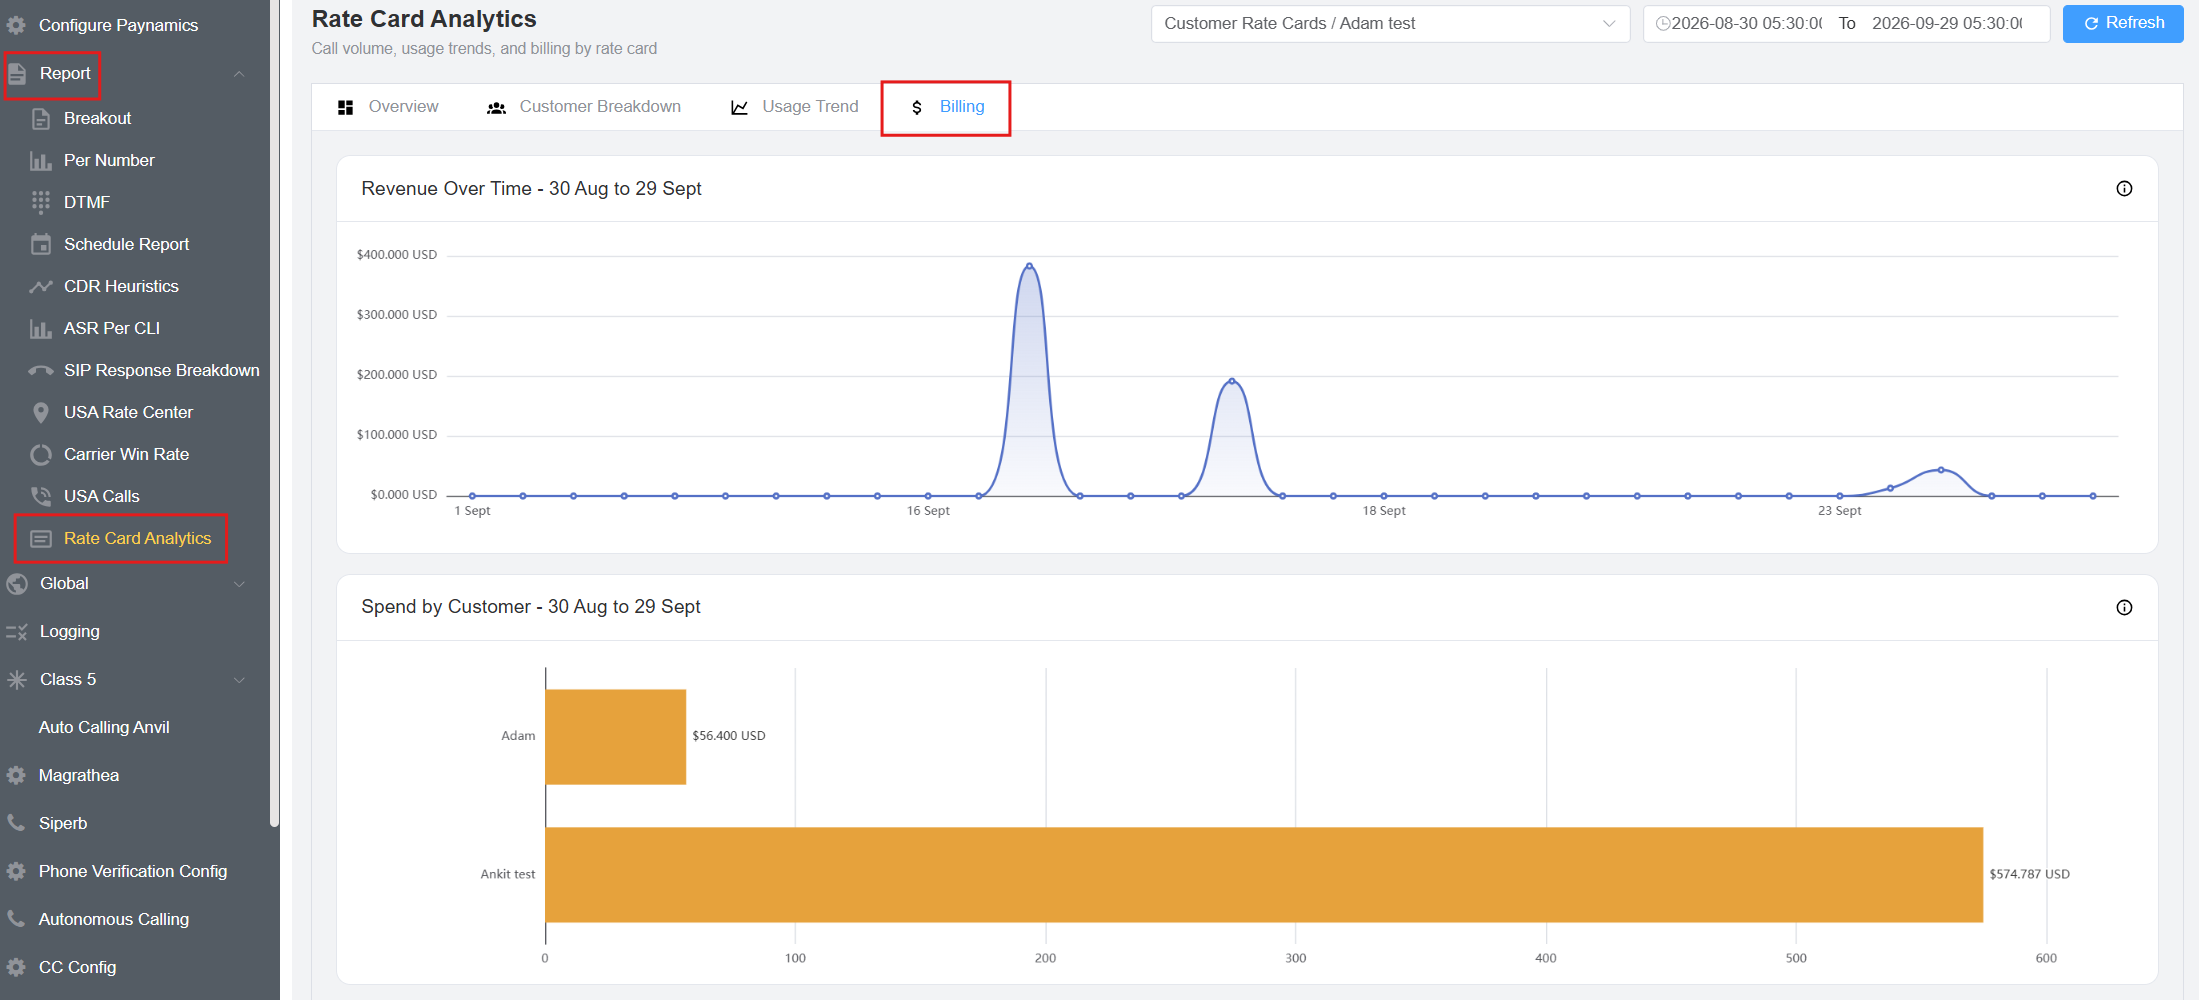
It includes two charts:
-
Revenue Over Time
The Revenue Over Time chart displays revenue generated through the selected rate card over the reporting period.
The chart shows how revenue changes over time, making it possible to identify periods with higher or lower revenue activity.
-
Spend by Customer
The Spend by Customer chart shows the amount spent by each customer during the selected reporting period.
For example, in the displayed report:
- Adam — $56.400 USD
- Ankit test — $574.787 USD
The chart allows customer spending to be compared within the selected rate card.
Together, these charts provide an overview of revenue generation over time and customer-level spending for the selected rate card.