DTMF Report
Document Metadata
Category: Reporting & Analytics / DTMF Report
Audience: Administrators, Billing Teams, Operations Teams, Support Teams, Engineers
Difficulty: Intermediate
Time Required: Approximately 15–30 minutes
Prerequisites: Active ConnexCS account with Reports access; familiarity with DTMF, customer and provider charges, call reporting, and basic routing concepts.
Related Topics: Reports, Breakout Report
Next Steps: Navigate to the DTMF report, select the required customers and date range, refresh the report, and use the Columns and Filters panels to analyze DTMF activity and associated customer and provider charges.
Report DTMF
Overview
The DTMF report provides information about Dual Tone Multi-Frequency (DTMF) activity associated with calls.
It's particularly useful for customers that generate DTMF traffic, such as voice broadcast systems and other applications that use keypad input during calls.
The report can be used to analyze the volume of DTMF activity and compare it with the associated Customer Charge and Provider Charge. This helps determine the cost-effectiveness of a route and understand the cost associated with DTMF activity.
Use Cases
The DTMF report can be used to:
-
Analyze DTMF traffic generated by customers.
-
Investigate DTMF activity from voice broadcast systems.
-
Determine the volume of DTMF digits or events associated with calls.
-
Compare Customer Charge and Provider Charge.
-
Evaluate the cost-effectiveness of a route for DTMF traffic.
-
Analyze DTMF activity by provider and date.
-
Investigate the cost associated with individual DTMF events.
-
Compare DTMF activity across selected customers and reporting periods.
Using the DTMF Report
-
Navigate to Reports DTMF.
-
Select the required Customers.
-
Specify the required date and time range.
-
Click Refresh to generate the report using the selected parameters.
-
Expand the report groups to view more detailed information, including provider and date-level data.
-
Use the Columns and Filters panels to customize and refine the report.
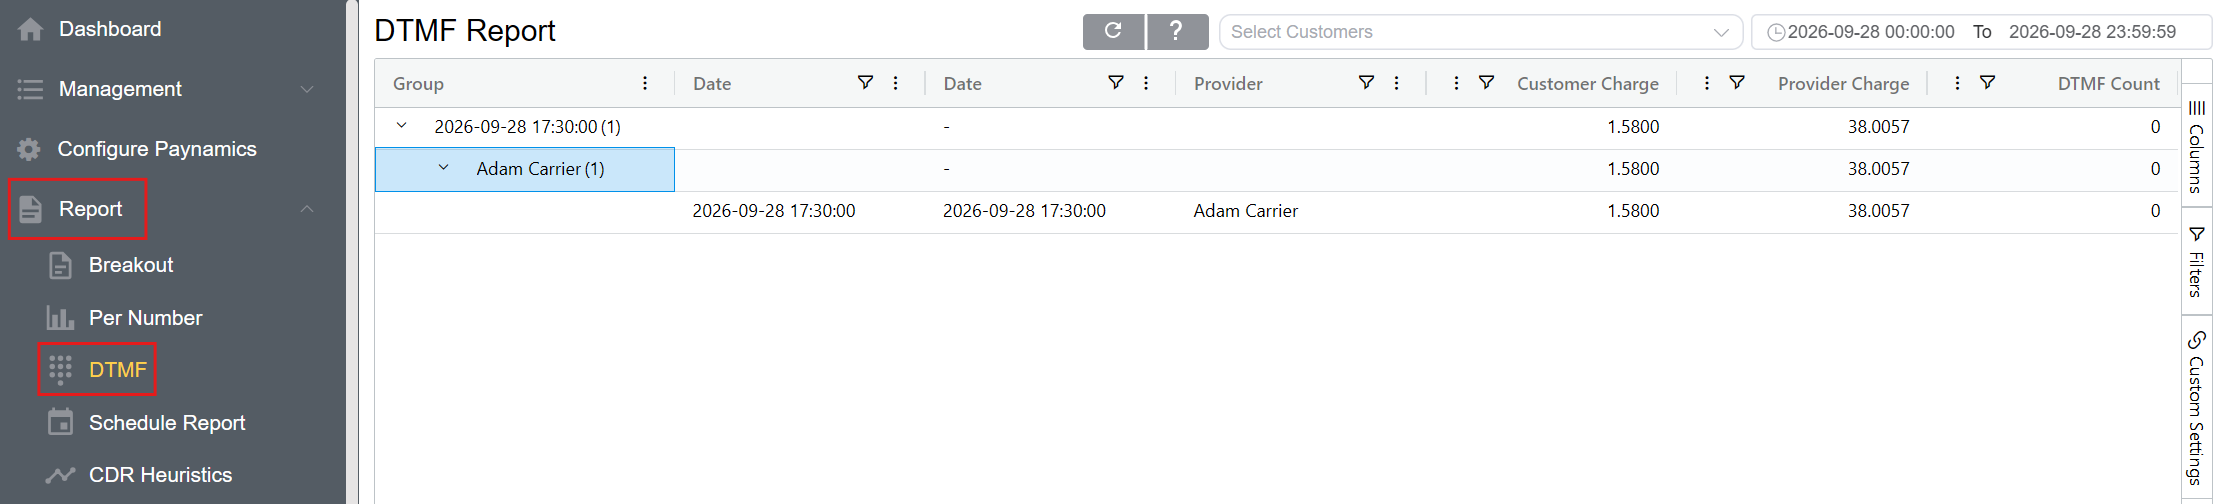
Note: The DTMF report can be used to compare the number of DTMF digits or events with the associated customer and provider charges.
Report Columns
The Columns panel allows you to select which fields are displayed in the report.
| Column | Description |
|---|---|
| Date | Date and time associated with the call or DTMF activity. |
| Provider | Provider associated with the call and its DTMF activity. |
| Customer Charge | Charge associated with the customer side of the call. |
| Provider Charge | Charge associated with the provider side of the call. |
| DTMF Count | Number of DTMF digits or events recorded for the selected call data. |
The report can organize information into groups, allowing DTMF activity to be viewed at different levels, such as by Date and Provider.
Analyzing DTMF Costs
The DTMF report can be used to compare DTMF activity with the associated charges.
For example, review the following fields to evaluate the cost-effectiveness of a route:
- DTMF Count — Shows the volume of DTMF activity.
- Customer Charge — Shows the charge associated with the customer.
- Provider Charge — Shows the cost associated with the provider.
- Provider — Identifies the provider associated with the DTMF activity.
This information can help identify the cost associated with DTMF traffic and evaluate the economics of the route being used.
Filters
The Filters panel allows you to refine the data displayed in the DTMF report by applying conditions to individual fields.
Select a field in the Filters panel and choose the required filter condition. The available conditions depend on the type of data in the selected field.
Custom Settings
The Custom Settings panel provides options for adjusting the appearance and presentation of the DTMF report.
-
Theme: The Theme setting allows you to select the visual theme used for the report interface. Select a theme from the available options to change the appearance of the report grid.
-
Row Height: The Row Height setting controls the vertical spacing of rows in the report grid. Use the slider to increase or decrease the amount of information displayed vertically on the screen.
-
Lower row height: Displays more rows at once.
-
Higher row height: Provides more spacing between rows for easier readability.
-
Custom settings affect the presentation of the report and don't change the underlying report data.
Grouping and Drill-Down
The DTMF report displays data in a hierarchical view. Groups can be expanded to move from a high-level summary to more detailed information.
For example, expanding a Date group can display the associated Provider and the underlying date-level information.
This allows DTMF activity and associated charges to be reviewed at different levels without changing the overall report.
Refreshing the Report
Click Refresh after changing the customer selection or date range to ensure the report reflects the current selections.
Refreshing the DTMF Report
Remember to click Refresh each time parameters change to ensure you see the most recent selections onscreen.
When refreshing the list, use the Report Refresh button rather than the browser refresh button.